

6 Molecular Magnetism of Metal Complexes and Light-Induced …
289
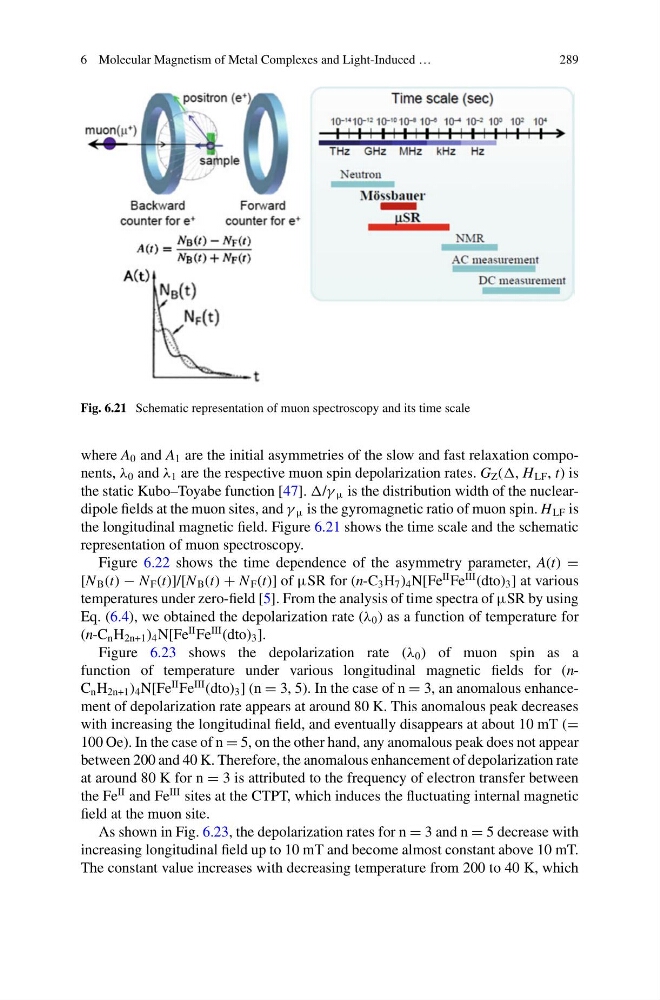
Fig. 6.21 Schematic representation of muon spectroscopy and its time scale
where A 0 and A 1 are the initial asymmetries of the slow and fast relaxation components, λ 0 and λ 1 are the respective muon spin depolarization rates. G Z (, H LF , t) is
the static Kubo–Toyabe function [47]. /γ μ is the distribution width of the nucleardipole fields at the muon sites, and γ μ is the gyromagnetic ratio of muon spin. H LF is
the longitudinal magnetic field. Figure 6.21 shows the time scale and the schematic
representation of muon spectroscopy.
Figure 6.22 shows the time dependence of the asymmetry parameter, A(t) =
[N B (t) − N F (t)]/[N B (t) + N F (t)] of μSR for (n-C 3 H 7 ) 4 N[Fe
II Fe
III (dto) 3 ] at various
temperatures under zero-field [5]. From the analysis of time spectra of μSR by using
Eq. (6.4), we obtained the depolarization rate (λ 0 ) as a function of temperature for
(n-C n H 2n+1 ) 4 N[Fe
II Fe
III (dto) 3 ].
Figure 6.23 shows the depolarization rate (λ 0 ) of muon spin as a
function of temperature under various longitudinal magnetic fields for (nC n H 2n+1 ) 4 N[Fe
II Fe
III (dto) 3 ] (n = 3, 5). In the case of n = 3, an anomalous enhancement of depolarization rate appears at around 80 K. This anomalous peak decreases
with increasing the longitudinal field, and eventually disappears at about 10 mT (=
100 Oe). In the case of n = 5, on the other hand, any anomalous peak does not appear
between 200 and 40 K. Therefore, the anomalous enhancement of depolarization rate
at around 80 K for n = 3 is attributed to the frequency of electron transfer between
the Fe
II and Fe
III sites at the CTPT, which induces the fluctuating internal magnetic
field at the muon site.
As shown in Fig. 6.23, the depolarization rates for n = 3 and n = 5 decrease with
increasing longitudinal field up to 10 mT and become almost constant above 10 mT.
The constant value increases with decreasing temperature from 200 to 40 K, which
289
Fig. 6.21 Schematic representation of muon spectroscopy and its time scale
where A 0 and A 1 are the initial asymmetries of the slow and fast relaxation components, λ 0 and λ 1 are the respective muon spin depolarization rates. G Z (, H LF , t) is
the static Kubo–Toyabe function [47]. /γ μ is the distribution width of the nucleardipole fields at the muon sites, and γ μ is the gyromagnetic ratio of muon spin. H LF is
the longitudinal magnetic field. Figure 6.21 shows the time scale and the schematic
representation of muon spectroscopy.
Figure 6.22 shows the time dependence of the asymmetry parameter, A(t) =
[N B (t) − N F (t)]/[N B (t) + N F (t)] of μSR for (n-C 3 H 7 ) 4 N[Fe
II Fe
III (dto) 3 ] at various
temperatures under zero-field [5]. From the analysis of time spectra of μSR by using
Eq. (6.4), we obtained the depolarization rate (λ 0 ) as a function of temperature for
(n-C n H 2n+1 ) 4 N[Fe
II Fe
III (dto) 3 ].
Figure 6.23 shows the depolarization rate (λ 0 ) of muon spin as a
function of temperature under various longitudinal magnetic fields for (nC n H 2n+1 ) 4 N[Fe
II Fe
III (dto) 3 ] (n = 3, 5). In the case of n = 3, an anomalous enhancement of depolarization rate appears at around 80 K. This anomalous peak decreases
with increasing the longitudinal field, and eventually disappears at about 10 mT (=
100 Oe). In the case of n = 5, on the other hand, any anomalous peak does not appear
between 200 and 40 K. Therefore, the anomalous enhancement of depolarization rate
at around 80 K for n = 3 is attributed to the frequency of electron transfer between
the Fe
II and Fe
III sites at the CTPT, which induces the fluctuating internal magnetic
field at the muon site.
As shown in Fig. 6.23, the depolarization rates for n = 3 and n = 5 decrease with
increasing longitudinal field up to 10 mT and become almost constant above 10 mT.
The constant value increases with decreasing temperature from 200 to 40 K, which