

2 Comprehensive Electrochemistry of Tc …
13
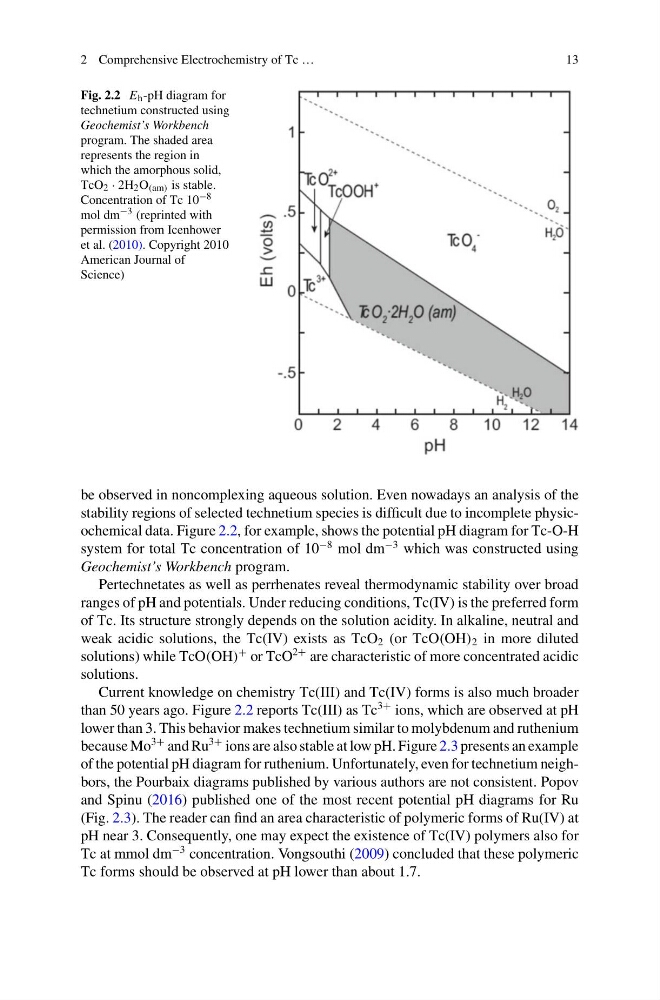
Fig. 2.2 E h -pH diagram for
technetium constructed using
Geochemist’s Workbench
program. The shaded area
represents the region in
which the amorphous solid,
TcO 2 · 2H 2 O (am) is stable.
Concentration of Tc 10 −8
mol dm −3 (reprinted with
permission from Icenhower
et al. (2010). Copyright 2010
American Journal of
Science)
be observed in noncomplexing aqueous solution. Even nowadays an analysis of the
stability regions of selected technetium species is difficult due to incomplete physicochemical data. Figure 2.2, for example, shows the potential pH diagram for Tc-O-H
system for total Tc concentration of 10
−8 mol dm
−3 which was constructed using
Geochemist’s Workbench program.
Pertechnetates as well as perrhenates reveal thermodynamic stability over broad
ranges of pH and potentials. Under reducing conditions, Tc(IV) is the preferred form
of Tc. Its structure strongly depends on the solution acidity. In alkaline, neutral and
weak acidic solutions, the Tc(IV) exists as TcO 2 (or TcO(OH) 2 in more diluted
solutions) while TcO(OH)
+ or TcO
2+ are characteristic of more concentrated acidic
solutions.
Current knowledge on chemistry Tc(III) and Tc(IV) forms is also much broader
than 50 years ago. Figure 2.2 reports Tc(III) as Tc
3+ ions, which are observed at pH
lower than 3. This behavior makes technetium similar to molybdenum and ruthenium
because Mo
3+ and Ru
3+ ions are also stable at low pH. Figure 2.3 presents an example
of the potential pH diagram for ruthenium. Unfortunately, even for technetium neighbors, the Pourbaix diagrams published by various authors are not consistent. Popov
and Spinu (2016) published one of the most recent potential pH diagrams for Ru
(Fig. 2.3). The reader can find an area characteristic of polymeric forms of Ru(IV) at
pH near 3. Consequently, one may expect the existence of Tc(IV) polymers also for
Tc at mmol dm
−3 concentration. Vongsouthi (2009) concluded that these polymeric
Tc forms should be observed at pH lower than about 1.7.
13
Fig. 2.2 E h -pH diagram for
technetium constructed using
Geochemist’s Workbench
program. The shaded area
represents the region in
which the amorphous solid,
TcO 2 · 2H 2 O (am) is stable.
Concentration of Tc 10 −8
mol dm −3 (reprinted with
permission from Icenhower
et al. (2010). Copyright 2010
American Journal of
Science)
be observed in noncomplexing aqueous solution. Even nowadays an analysis of the
stability regions of selected technetium species is difficult due to incomplete physicochemical data. Figure 2.2, for example, shows the potential pH diagram for Tc-O-H
system for total Tc concentration of 10
−8 mol dm
−3 which was constructed using
Geochemist’s Workbench program.
Pertechnetates as well as perrhenates reveal thermodynamic stability over broad
ranges of pH and potentials. Under reducing conditions, Tc(IV) is the preferred form
of Tc. Its structure strongly depends on the solution acidity. In alkaline, neutral and
weak acidic solutions, the Tc(IV) exists as TcO 2 (or TcO(OH) 2 in more diluted
solutions) while TcO(OH)
+ or TcO
2+ are characteristic of more concentrated acidic
solutions.
Current knowledge on chemistry Tc(III) and Tc(IV) forms is also much broader
than 50 years ago. Figure 2.2 reports Tc(III) as Tc
3+ ions, which are observed at pH
lower than 3. This behavior makes technetium similar to molybdenum and ruthenium
because Mo
3+ and Ru
3+ ions are also stable at low pH. Figure 2.3 presents an example
of the potential pH diagram for ruthenium. Unfortunately, even for technetium neighbors, the Pourbaix diagrams published by various authors are not consistent. Popov
and Spinu (2016) published one of the most recent potential pH diagrams for Ru
(Fig. 2.3). The reader can find an area characteristic of polymeric forms of Ru(IV) at
pH near 3. Consequently, one may expect the existence of Tc(IV) polymers also for
Tc at mmol dm
−3 concentration. Vongsouthi (2009) concluded that these polymeric
Tc forms should be observed at pH lower than about 1.7.