

12
2 Comprehensive Electrochemistry of Tc …
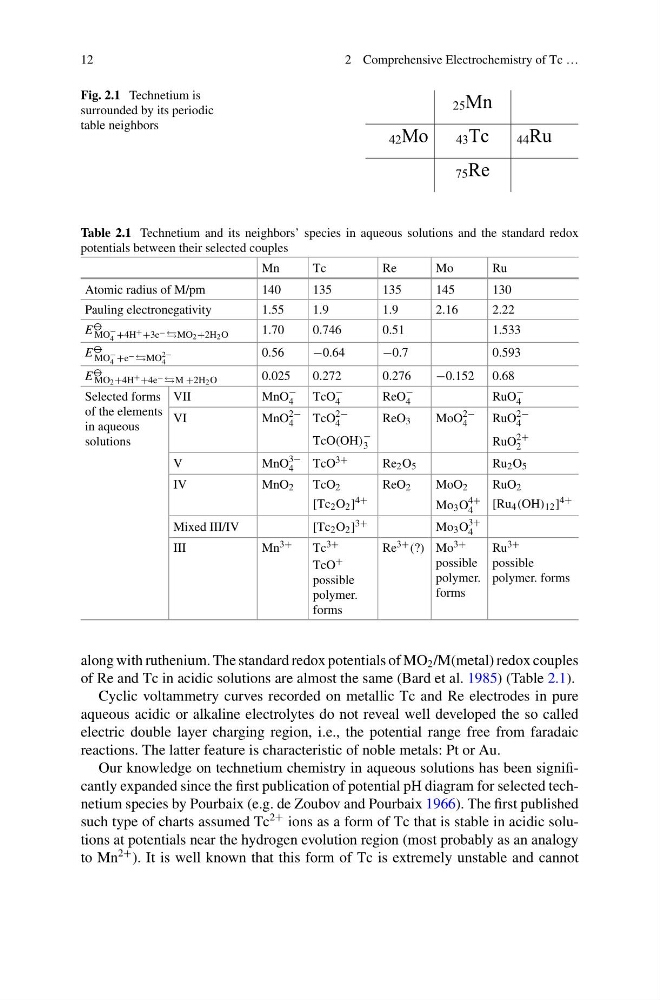
Fig. 2.1 Technetium is
surrounded by its periodic
table neighbors
25 Mn
42 Mo 43 Tc 44 Ru
75 Re
Table 2.1 Technetium and its neighbors’ species in aqueous solutions and the standard redox
potentials between their selected couples
Mn
Tc
Re
Mo
Ru
Atomic radius of M/pm
140
135
135
145
130
Pauling electronegativity
1.55
1.9
1.9
2.16
2.22
E ⦵
MO
−
4 +4H + +3e − MO2+2H2O
1.70
0.746
0.51
1.533
E ⦵
MO
−
4 +e − MO
2−
4
0.56
−0.64
−0.7
0.593
E ⦵
MO2+4H + +4e − +2H2O
0.025
0.272
0.276
−0.152 0.68
Selected forms
of the elements
in aqueous
solutions
VII
MnO
−
4
TcO
−
4
ReO
−
4
RuO
−
4
VI
MnO
2−
4
TcO
2−
4
TcO(OH)
−
3
ReO 3
MoO
2−
4
RuO
2−
4
RuO
2+
2
V
MnO
3−
4
TcO 3+
Re 2 O 5
Ru 2 O 5
IV
MnO 2
TcO 2
[Tc 2 O 2 ] 4+
ReO 2
MoO 2
Mo 3 O
4+
4
RuO 2
[Ru 4 (OH) 12 ] 4+
Mixed III/IV
[Tc 2 O 2 ] 3+
Mo 3 O
3+
4
III
Mn 3+
Tc 3+
TcO +
possible
polymer.
forms
Re 3+ (?) Mo 3+
possible
polymer.
forms
Ru 3+
possible
polymer. forms
along with ruthenium. The standard redox potentials of MO 2 /M(metal) redox couples
of Re and Tc in acidic solutions are almost the same (Bard et al. 1985) (Table 2.1).
Cyclic voltammetry curves recorded on metallic Tc and Re electrodes in pure
aqueous acidic or alkaline electrolytes do not reveal well developed the so called
electric double layer charging region, i.e., the potential range free from faradaic
reactions. The latter feature is characteristic of noble metals: Pt or Au.
Our knowledge on technetium chemistry in aqueous solutions has been significantly expanded since the first publication of potential pH diagram for selected technetium species by Pourbaix (e.g. de Zoubov and Pourbaix 1966). The first published
such type of charts assumed Tc
2+ ions as a form of Tc that is stable in acidic solutions at potentials near the hydrogen evolution region (most probably as an analogy
to Mn
2+ ). It is well known that this form of Tc is extremely unstable and cannot
2 Comprehensive Electrochemistry of Tc …
Fig. 2.1 Technetium is
surrounded by its periodic
table neighbors
25 Mn
42 Mo 43 Tc 44 Ru
75 Re
Table 2.1 Technetium and its neighbors’ species in aqueous solutions and the standard redox
potentials between their selected couples
Mn
Tc
Re
Mo
Ru
Atomic radius of M/pm
140
135
135
145
130
Pauling electronegativity
1.55
1.9
1.9
2.16
2.22
E ⦵
MO
−
4 +4H + +3e − MO2+2H2O
1.70
0.746
0.51
1.533
E ⦵
MO
−
4 +e − MO
2−
4
0.56
−0.64
−0.7
0.593
E ⦵
MO2+4H + +4e − +2H2O
0.025
0.272
0.276
−0.152 0.68
Selected forms
of the elements
in aqueous
solutions
VII
MnO
−
4
TcO
−
4
ReO
−
4
RuO
−
4
VI
MnO
2−
4
TcO
2−
4
TcO(OH)
−
3
ReO 3
MoO
2−
4
RuO
2−
4
RuO
2+
2
V
MnO
3−
4
TcO 3+
Re 2 O 5
Ru 2 O 5
IV
MnO 2
TcO 2
[Tc 2 O 2 ] 4+
ReO 2
MoO 2
Mo 3 O
4+
4
RuO 2
[Ru 4 (OH) 12 ] 4+
Mixed III/IV
[Tc 2 O 2 ] 3+
Mo 3 O
3+
4
III
Mn 3+
Tc 3+
TcO +
possible
polymer.
forms
Re 3+ (?) Mo 3+
possible
polymer.
forms
Ru 3+
possible
polymer. forms
along with ruthenium. The standard redox potentials of MO 2 /M(metal) redox couples
of Re and Tc in acidic solutions are almost the same (Bard et al. 1985) (Table 2.1).
Cyclic voltammetry curves recorded on metallic Tc and Re electrodes in pure
aqueous acidic or alkaline electrolytes do not reveal well developed the so called
electric double layer charging region, i.e., the potential range free from faradaic
reactions. The latter feature is characteristic of noble metals: Pt or Au.
Our knowledge on technetium chemistry in aqueous solutions has been significantly expanded since the first publication of potential pH diagram for selected technetium species by Pourbaix (e.g. de Zoubov and Pourbaix 1966). The first published
such type of charts assumed Tc
2+ ions as a form of Tc that is stable in acidic solutions at potentials near the hydrogen evolution region (most probably as an analogy
to Mn
2+ ). It is well known that this form of Tc is extremely unstable and cannot