

126
5 Metallic Technetium, Corrosion, Technetium Alloys …
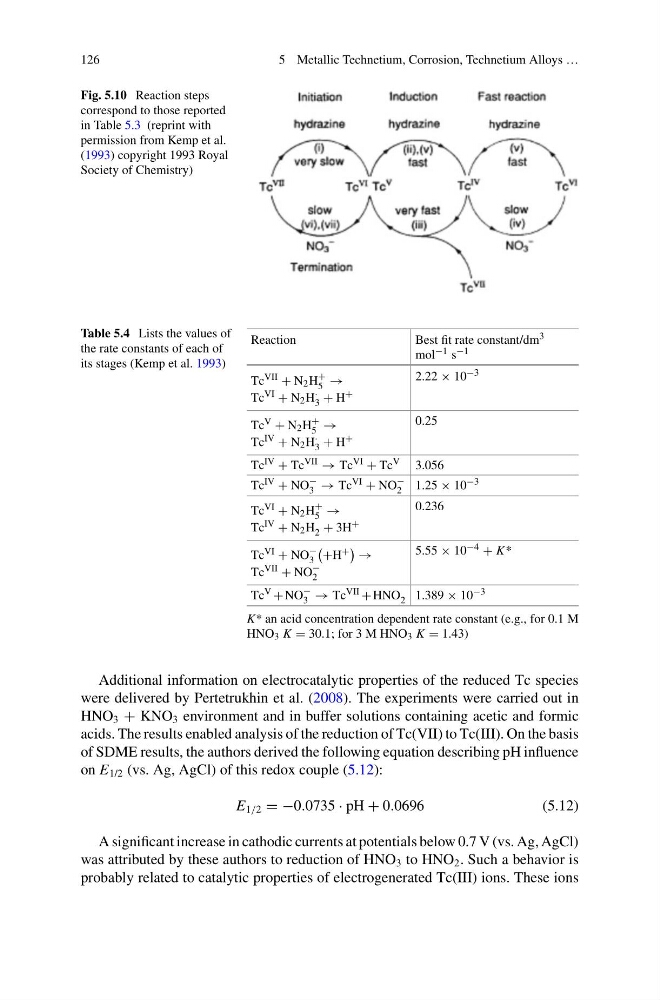
Fig. 5.10 Reaction steps
correspond to those reported
in Table 5.3 (reprint with
permission from Kemp et al.
(1993) copyright 1993 Royal
Society of Chemistry)
Table 5.4 Lists the values of
the rate constants of each of
its stages (Kemp et al. 1993)
Reaction
Best fit rate constant/dm 3
mol −1 s −1
Tc VII + N 2 H
+
5 →
Tc VI + N 2 H ·
3 + H +
2.22 × 10 −3
Tc V + N 2 H
+
5 →
Tc IV + N 2 H ·
3 + H +
0.25
Tc IV + Tc VII → Tc VI + Tc V 3.056
Tc IV + NO
−
3 → Tc VI + NO
−
2 1.25 × 10 −3
Tc VI + N 2 H
+
5 →
Tc IV + N 2 H 2 + 3H +
0.236
Tc VI + NO
−
3
+H + →
Tc VII + NO
−
2
5.55 × 10 −4 + K*
Tc V + NO
−
3 → Tc VII + HNO 2 1.389 × 10 −3
K* an acid concentration dependent rate constant (e.g., for 0.1 M
HNO 3 K = 30.1; for 3 M HNO 3 K = 1.43)
Additional information on electrocatalytic properties of the reduced Tc species
were delivered by Pertetrukhin et al. (2008). The experiments were carried out in
HNO 3 + KNO 3 environment and in buffer solutions containing acetic and formic
acids. The results enabled analysis of the reduction of Tc(VII) to Tc(III). On the basis
of SDME results, the authors derived the following equation describing pH influence
on E 1/2 (vs. Ag, AgCl) of this redox couple (5.12):
E 1/2 = −0.0735 · pH + 0.0696
(5.12)
A significant increase in cathodic currents at potentials below 0.7 V (vs. Ag, AgCl)
was attributed by these authors to reduction of HNO 3 to HNO 2 . Such a behavior is
probably related to catalytic properties of electrogenerated Tc(III) ions. These ions
5 Metallic Technetium, Corrosion, Technetium Alloys …
Fig. 5.10 Reaction steps
correspond to those reported
in Table 5.3 (reprint with
permission from Kemp et al.
(1993) copyright 1993 Royal
Society of Chemistry)
Table 5.4 Lists the values of
the rate constants of each of
its stages (Kemp et al. 1993)
Reaction
Best fit rate constant/dm 3
mol −1 s −1
Tc VII + N 2 H
+
5 →
Tc VI + N 2 H ·
3 + H +
2.22 × 10 −3
Tc V + N 2 H
+
5 →
Tc IV + N 2 H ·
3 + H +
0.25
Tc IV + Tc VII → Tc VI + Tc V 3.056
Tc IV + NO
−
3 → Tc VI + NO
−
2 1.25 × 10 −3
Tc VI + N 2 H
+
5 →
Tc IV + N 2 H 2 + 3H +
0.236
Tc VI + NO
−
3
+H + →
Tc VII + NO
−
2
5.55 × 10 −4 + K*
Tc V + NO
−
3 → Tc VII + HNO 2 1.389 × 10 −3
K* an acid concentration dependent rate constant (e.g., for 0.1 M
HNO 3 K = 30.1; for 3 M HNO 3 K = 1.43)
Additional information on electrocatalytic properties of the reduced Tc species
were delivered by Pertetrukhin et al. (2008). The experiments were carried out in
HNO 3 + KNO 3 environment and in buffer solutions containing acetic and formic
acids. The results enabled analysis of the reduction of Tc(VII) to Tc(III). On the basis
of SDME results, the authors derived the following equation describing pH influence
on E 1/2 (vs. Ag, AgCl) of this redox couple (5.12):
E 1/2 = −0.0735 · pH + 0.0696
(5.12)
A significant increase in cathodic currents at potentials below 0.7 V (vs. Ag, AgCl)
was attributed by these authors to reduction of HNO 3 to HNO 2 . Such a behavior is
probably related to catalytic properties of electrogenerated Tc(III) ions. These ions