

Spectroscopic Characterization and Molecular Dynamics Simulation
35
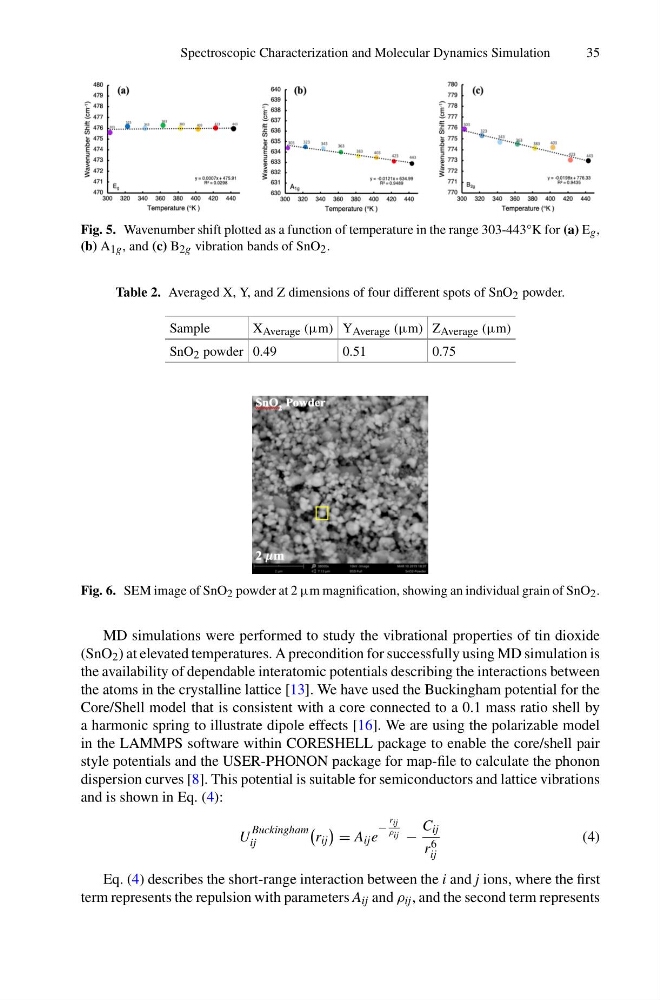
Fig. 5. Wavenumber shift plotted as a function of temperature in the range 303-443°K for (a) E g ,
(b) A 1g , and (c) B 2g vibration bands of SnO 2 .
Table 2. Averaged X, Y, and Z dimensions of four different spots of SnO 2 powder.
Sample
X Average (μm) Y Average (μm) Z Average (μm)
SnO 2 powder 0.49
0.51
0.75
Fig. 6. SEM image of SnO 2 powder at 2 μm magnification, showing an individual grain of SnO 2 .
MD simulations were performed to study the vibrational properties of tin dioxide
(SnO 2 ) at elevated temperatures. A precondition for successfully using MD simulation is
the availability of dependable interatomic potentials describing the interactions between
the atoms in the crystalline lattice [13]. We have used the Buckingham potential for the
Core/Shell model that is consistent with a core connected to a 0.1 mass ratio shell by
a harmonic spring to illustrate dipole effects [16]. We are using the polarizable model
in the LAMMPS software within CORESHELL package to enable the core/shell pair
style potentials and the USER-PHONON package for map-file to calculate the phonon
dispersion curves [8]. This potential is suitable for semiconductors and lattice vibrations
and is shown in Eq. (4):
U
Buckingham
ij
r ij
= A ij e
−
r ij
ρ ij −
C ij
r 6
ij
(4)
Eq. (4) describes the short-range interaction between the i and j ions, where the first
term represents the repulsion with parameters A ij and ρ ij , and the second term represents
35
Fig. 5. Wavenumber shift plotted as a function of temperature in the range 303-443°K for (a) E g ,
(b) A 1g , and (c) B 2g vibration bands of SnO 2 .
Table 2. Averaged X, Y, and Z dimensions of four different spots of SnO 2 powder.
Sample
X Average (μm) Y Average (μm) Z Average (μm)
SnO 2 powder 0.49
0.51
0.75
Fig. 6. SEM image of SnO 2 powder at 2 μm magnification, showing an individual grain of SnO 2 .
MD simulations were performed to study the vibrational properties of tin dioxide
(SnO 2 ) at elevated temperatures. A precondition for successfully using MD simulation is
the availability of dependable interatomic potentials describing the interactions between
the atoms in the crystalline lattice [13]. We have used the Buckingham potential for the
Core/Shell model that is consistent with a core connected to a 0.1 mass ratio shell by
a harmonic spring to illustrate dipole effects [16]. We are using the polarizable model
in the LAMMPS software within CORESHELL package to enable the core/shell pair
style potentials and the USER-PHONON package for map-file to calculate the phonon
dispersion curves [8]. This potential is suitable for semiconductors and lattice vibrations
and is shown in Eq. (4):
U
Buckingham
ij
r ij
= A ij e
−
r ij
ρ ij −
C ij
r 6
ij
(4)
Eq. (4) describes the short-range interaction between the i and j ions, where the first
term represents the repulsion with parameters A ij and ρ ij , and the second term represents