

Spectroscopic Characterization and Molecular Dynamics Simulation
33
the GnP samples consist of short stacks of 3–6 layers of graphene. A supercell consisting
of 10 Å × 10 Å unit cells was created for each layer with a total of 600 atoms to model
trilayer graphene. The length of the simulation box used in the x and y directions were:
L X = 24.85 Å, L Y = 21.52 Å, with a vacuum region of 35 Å applied in the z direction,
in order to avoid interaction between the periodic images. A time step of 0.002 ps (metal
units) was used during the NVE simulation - with a total run time of 16 ns - for proper
equilibration of the system.
3 Results and Discussion
3.1 Tin Dioxide (SnO 2 )
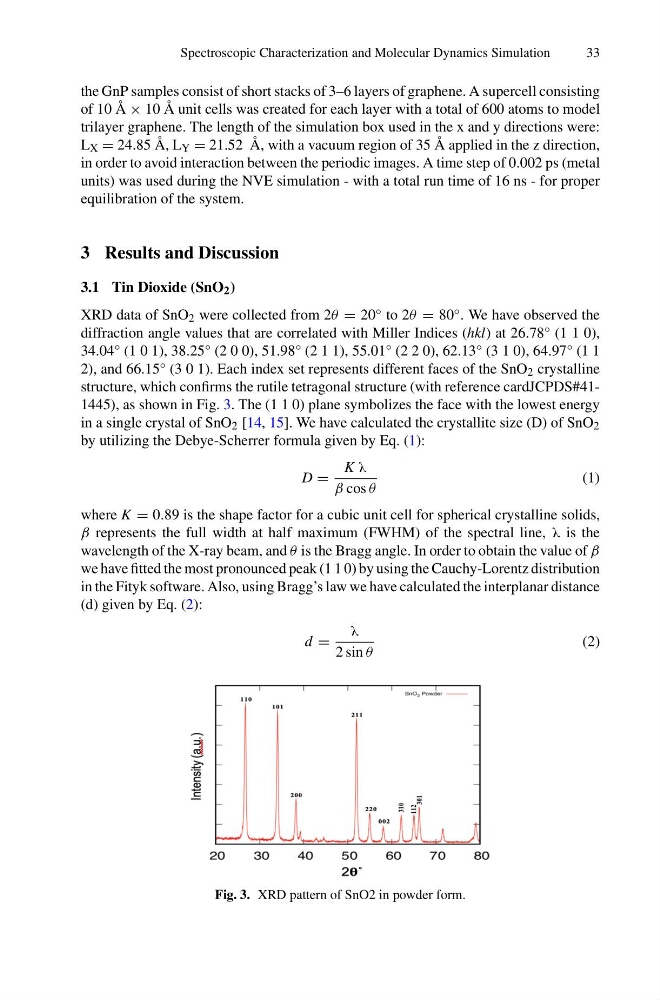
XRD data of SnO 2 were collected from 2θ = 20 ◦ to 2θ = 80 ◦ . We have observed the
diffraction angle values that are correlated with Miller Indices (hkl) at 26.78° (1 1 0),
34.04° (1 0 1), 38.25° (2 0 0), 51.98° (2 1 1), 55.01° (2 2 0), 62.13° (3 1 0), 64.97° (1 1
2), and 66.15° (3 0 1). Each index set represents different faces of the SnO 2 crystalline
structure, which confirms the rutile tetragonal structure (with reference cardJCPDS#411445), as shown in Fig. 3. The (1 1 0) plane symbolizes the face with the lowest energy
in a single crystal of SnO 2 [14, 15]. We have calculated the crystallite size (D) of SnO 2
by utilizing the Debye-Scherrer formula given by Eq. (1):
D =
K λ
β cos θ
(1)
where K = 0.89 is the shape factor for a cubic unit cell for spherical crystalline solids,
β represents the full width at half maximum (FWHM) of the spectral line, λ is the
wavelength of the X-ray beam, and θ is the Bragg angle. In order to obtain the value of β
we have fitted the most pronounced peak (1 1 0) by using the Cauchy-Lorentz distribution
in the Fityk software. Also, using Bragg’s law we have calculated the interplanar distance
(d) given by Eq. (2):
d =
λ
2 sin θ
(2)
Fig. 3. XRD pattern of SnO2 in powder form.
33
the GnP samples consist of short stacks of 3–6 layers of graphene. A supercell consisting
of 10 Å × 10 Å unit cells was created for each layer with a total of 600 atoms to model
trilayer graphene. The length of the simulation box used in the x and y directions were:
L X = 24.85 Å, L Y = 21.52 Å, with a vacuum region of 35 Å applied in the z direction,
in order to avoid interaction between the periodic images. A time step of 0.002 ps (metal
units) was used during the NVE simulation - with a total run time of 16 ns - for proper
equilibration of the system.
3 Results and Discussion
3.1 Tin Dioxide (SnO 2 )
XRD data of SnO 2 were collected from 2θ = 20 ◦ to 2θ = 80 ◦ . We have observed the
diffraction angle values that are correlated with Miller Indices (hkl) at 26.78° (1 1 0),
34.04° (1 0 1), 38.25° (2 0 0), 51.98° (2 1 1), 55.01° (2 2 0), 62.13° (3 1 0), 64.97° (1 1
2), and 66.15° (3 0 1). Each index set represents different faces of the SnO 2 crystalline
structure, which confirms the rutile tetragonal structure (with reference cardJCPDS#411445), as shown in Fig. 3. The (1 1 0) plane symbolizes the face with the lowest energy
in a single crystal of SnO 2 [14, 15]. We have calculated the crystallite size (D) of SnO 2
by utilizing the Debye-Scherrer formula given by Eq. (1):
D =
K λ
β cos θ
(1)
where K = 0.89 is the shape factor for a cubic unit cell for spherical crystalline solids,
β represents the full width at half maximum (FWHM) of the spectral line, λ is the
wavelength of the X-ray beam, and θ is the Bragg angle. In order to obtain the value of β
we have fitted the most pronounced peak (1 1 0) by using the Cauchy-Lorentz distribution
in the Fityk software. Also, using Bragg’s law we have calculated the interplanar distance
(d) given by Eq. (2):
d =
λ
2 sin θ
(2)
Fig. 3. XRD pattern of SnO2 in powder form.