

Preliminary Study on Integrated Simulation
297
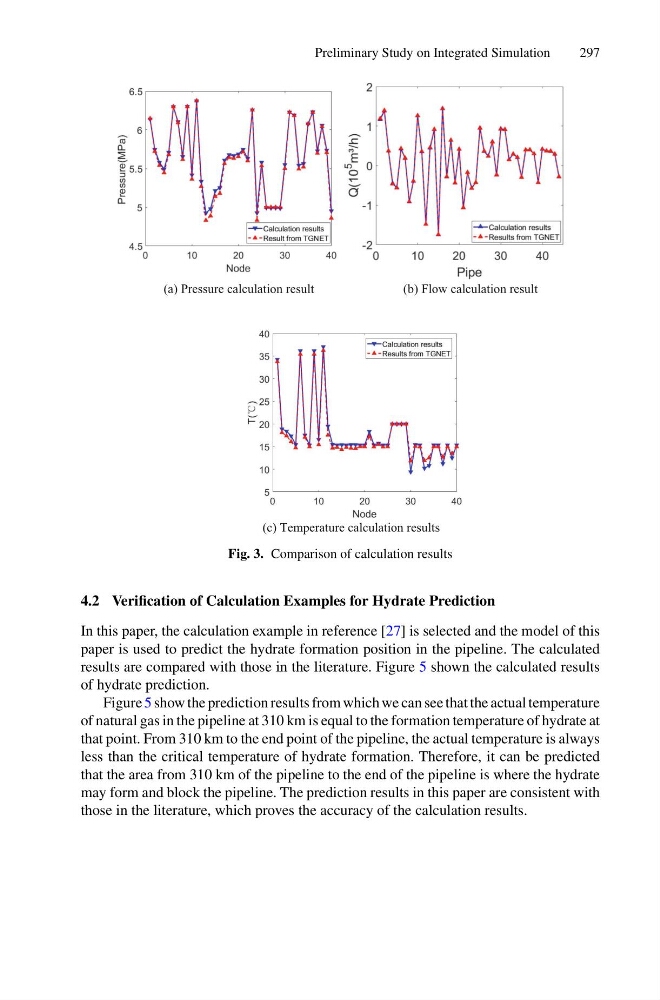
(a) Pressure calculation result
(b) Flow calculation result
(c) Temperature calculation results
Fig. 3. Comparison of calculation results
4.2 Verification of Calculation Examples for Hydrate Prediction
In this paper, the calculation example in reference [27] is selected and the model of this
paper is used to predict the hydrate formation position in the pipeline. The calculated
results are compared with those in the literature. Figure 5 shown the calculated results
of hydrate prediction.
Figure 5 show the prediction results from which we can see that the actual temperature
of natural gas in the pipeline at 310 km is equal to the formation temperature of hydrate at
that point. From 310 km to the end point of the pipeline, the actual temperature is always
less than the critical temperature of hydrate formation. Therefore, it can be predicted
that the area from 310 km of the pipeline to the end of the pipeline is where the hydrate
may form and block the pipeline. The prediction results in this paper are consistent with
those in the literature, which proves the accuracy of the calculation results.
297
(a) Pressure calculation result
(b) Flow calculation result
(c) Temperature calculation results
Fig. 3. Comparison of calculation results
4.2 Verification of Calculation Examples for Hydrate Prediction
In this paper, the calculation example in reference [27] is selected and the model of this
paper is used to predict the hydrate formation position in the pipeline. The calculated
results are compared with those in the literature. Figure 5 shown the calculated results
of hydrate prediction.
Figure 5 show the prediction results from which we can see that the actual temperature
of natural gas in the pipeline at 310 km is equal to the formation temperature of hydrate at
that point. From 310 km to the end point of the pipeline, the actual temperature is always
less than the critical temperature of hydrate formation. Therefore, it can be predicted
that the area from 310 km of the pipeline to the end of the pipeline is where the hydrate
may form and block the pipeline. The prediction results in this paper are consistent with
those in the literature, which proves the accuracy of the calculation results.