

Optimal Design of Natural Gas Gathering Systems
269
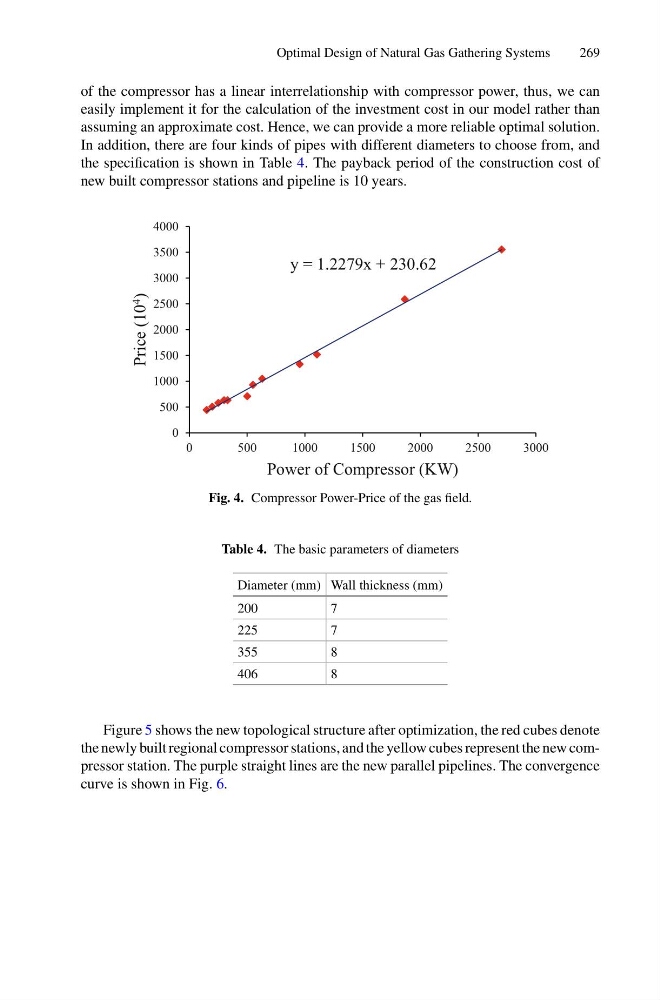
of the compressor has a linear interrelationship with compressor power, thus, we can
easily implement it for the calculation of the investment cost in our model rather than
assuming an approximate cost. Hence, we can provide a more reliable optimal solution.
In addition, there are four kinds of pipes with different diameters to choose from, and
the specification is shown in Table 4. The payback period of the construction cost of
new built compressor stations and pipeline is 10 years.
y = 1.2279x + 230.62
0
500
1000
1500
2000
2500
3000
3500
4000
0
500
1000
1500
2000
2500
3000
Price (10 4
)
Power of Compressor (KW)
Fig. 4. Compressor Power-Price of the gas field.
Table 4. The basic parameters of diameters
Diameter (mm) Wall thickness (mm)
200
7
225
7
355
8
406
8
Figure 5 shows the new topological structure after optimization, the red cubes denote
the newly built regional compressor stations, and the yellow cubes represent the new compressor station. The purple straight lines are the new parallel pipelines. The convergence
curve is shown in Fig. 6.
269
of the compressor has a linear interrelationship with compressor power, thus, we can
easily implement it for the calculation of the investment cost in our model rather than
assuming an approximate cost. Hence, we can provide a more reliable optimal solution.
In addition, there are four kinds of pipes with different diameters to choose from, and
the specification is shown in Table 4. The payback period of the construction cost of
new built compressor stations and pipeline is 10 years.
y = 1.2279x + 230.62
0
500
1000
1500
2000
2500
3000
3500
4000
0
500
1000
1500
2000
2500
3000
Price (10 4
)
Power of Compressor (KW)
Fig. 4. Compressor Power-Price of the gas field.
Table 4. The basic parameters of diameters
Diameter (mm) Wall thickness (mm)
200
7
225
7
355
8
406
8
Figure 5 shows the new topological structure after optimization, the red cubes denote
the newly built regional compressor stations, and the yellow cubes represent the new compressor station. The purple straight lines are the new parallel pipelines. The convergence
curve is shown in Fig. 6.