

Full-Scale Forced Vibration Tests of a Railway Bridge
231
10
7
10
8
10
9
10
10
10
11
10
12
K v (N/m)
8
10
12
14
16
18
f (Hz)
f 1
f 2
f 3
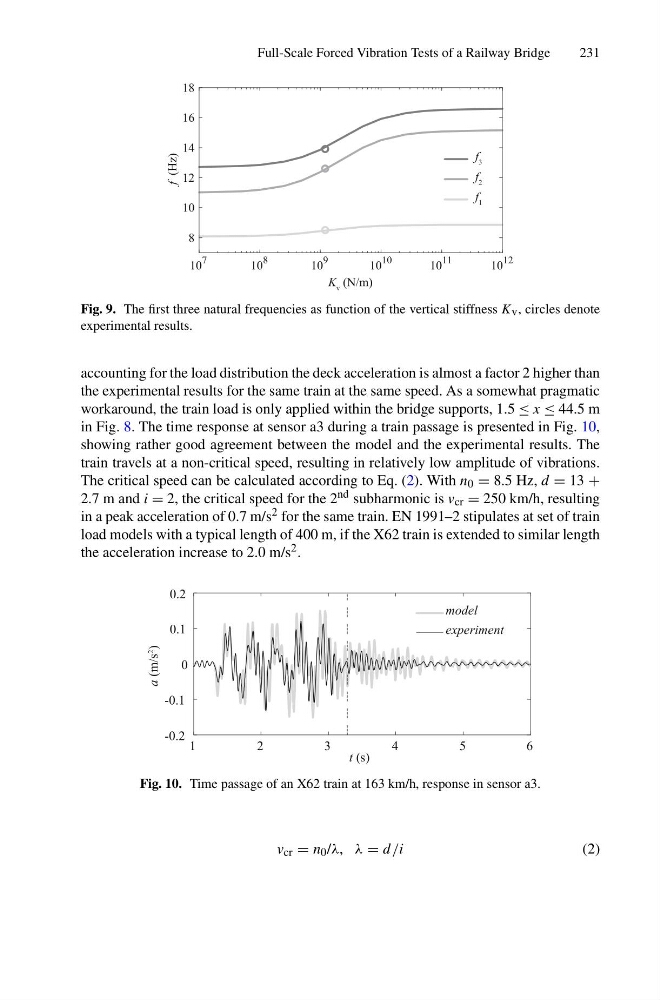
Fig. 9. The first three natural frequencies as function of the vertical stiffness K v , circles denote
experimental results.
accounting for the load distribution the deck acceleration is almost a factor 2 higher than
the experimental results for the same train at the same speed. As a somewhat pragmatic
workaround, the train load is only applied within the bridge supports, 1.5 ≤ x ≤ 44.5 m
in Fig. 8. The time response at sensor a3 during a train passage is presented in Fig. 10,
showing rather good agreement between the model and the experimental results. The
train travels at a non-critical speed, resulting in relatively low amplitude of vibrations.
The critical speed can be calculated according to Eq. (2). With n 0 = 8.5 Hz, d = 13 +
2.7 m and i = 2, the critical speed for the 2 nd subharmonic is v cr = 250 km/h, resulting
in a peak acceleration of 0.7 m/s 2 for the same train. EN 1991–2 stipulates at set of train
load models with a typical length of 400 m, if the X62 train is extended to similar length
the acceleration increase to 2.0 m/s 2 .
1
2
3
4
5
6
t (s)
-0.2
-0.1
0
0.1
0.2
a (m/s
2
)
model
experiment
Fig. 10. Time passage of an X62 train at 163 km/h, response in sensor a3.
v cr = n 0 /λ, λ = d /i
(2)
231
10
7
10
8
10
9
10
10
10
11
10
12
K v (N/m)
8
10
12
14
16
18
f (Hz)
f 1
f 2
f 3
Fig. 9. The first three natural frequencies as function of the vertical stiffness K v , circles denote
experimental results.
accounting for the load distribution the deck acceleration is almost a factor 2 higher than
the experimental results for the same train at the same speed. As a somewhat pragmatic
workaround, the train load is only applied within the bridge supports, 1.5 ≤ x ≤ 44.5 m
in Fig. 8. The time response at sensor a3 during a train passage is presented in Fig. 10,
showing rather good agreement between the model and the experimental results. The
train travels at a non-critical speed, resulting in relatively low amplitude of vibrations.
The critical speed can be calculated according to Eq. (2). With n 0 = 8.5 Hz, d = 13 +
2.7 m and i = 2, the critical speed for the 2 nd subharmonic is v cr = 250 km/h, resulting
in a peak acceleration of 0.7 m/s 2 for the same train. EN 1991–2 stipulates at set of train
load models with a typical length of 400 m, if the X62 train is extended to similar length
the acceleration increase to 2.0 m/s 2 .
1
2
3
4
5
6
t (s)
-0.2
-0.1
0
0.1
0.2
a (m/s
2
)
model
experiment
Fig. 10. Time passage of an X62 train at 163 km/h, response in sensor a3.
v cr = n 0 /λ, λ = d /i
(2)