

Influence of Ballast Track on Vertical Response of Multi-span SS Bridges
9
t (s)
f (Hz)
t (s)
f (Hz)
a x
L
@ =0.5 (m/s )
2
a x
L
@ =0.5 (m/s /Hz)
2
a x
L
@ =0.75 (m/s )
2
a x
L
@ =0.75 (m/s /Hz)
2
Numerical
Experimental A5
Numerical
Experimental A5
Numerical
Experimental A6
Numerical
Experimental A6
(a)
(c)
(b)
(d)
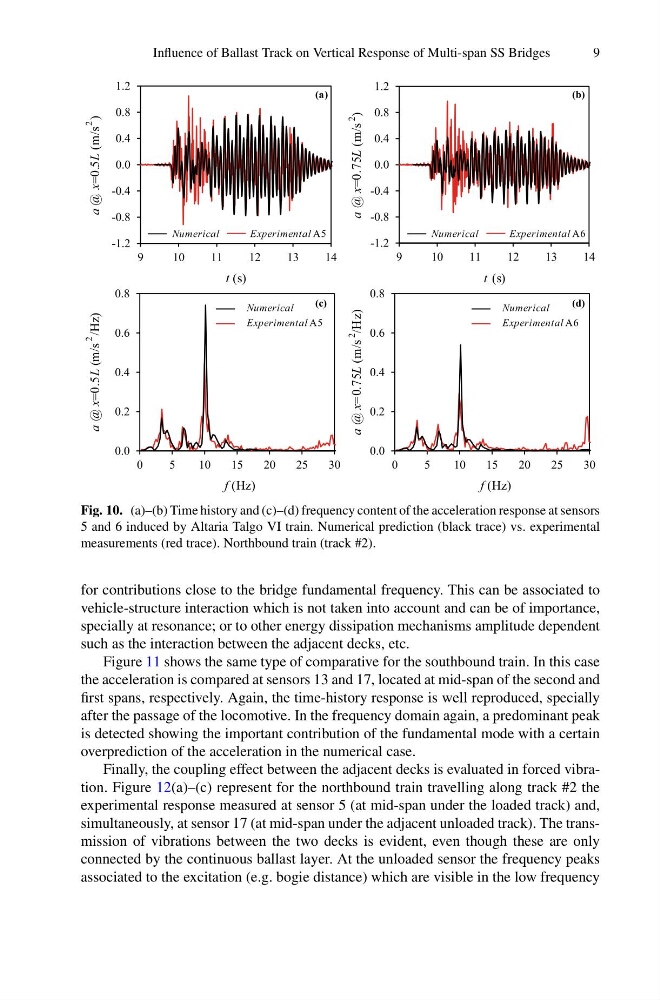
Fig. 10. (a)–(b) Time history and (c)–(d) frequency content of the acceleration response at sensors
5 and 6 induced by Altaria Talgo VI train. Numerical prediction (black trace) vs. experimental
measurements (red trace). Northbound train (track #2).
for contributions close to the bridge fundamental frequency. This can be associated to
vehicle-structure interaction which is not taken into account and can be of importance,
specially at resonance; or to other energy dissipation mechanisms amplitude dependent
such as the interaction between the adjacent decks, etc.
Figure 11 shows the same type of comparative for the southbound train. In this case
the acceleration is compared at sensors 13 and 17, located at mid-span of the second and
first spans, respectively. Again, the time-history response is well reproduced, specially
after the passage of the locomotive. In the frequency domain again, a predominant peak
is detected showing the important contribution of the fundamental mode with a certain
overprediction of the acceleration in the numerical case.
Finally, the coupling effect between the adjacent decks is evaluated in forced vibration. Figure 12(a)–(c) represent for the northbound train travelling along track #2 the
experimental response measured at sensor 5 (at mid-span under the loaded track) and,
simultaneously, at sensor 17 (at mid-span under the adjacent unloaded track). The transmission of vibrations between the two decks is evident, even though these are only
connected by the continuous ballast layer. At the unloaded sensor the frequency peaks
associated to the excitation (e.g. bogie distance) which are visible in the low frequency
9
t (s)
f (Hz)
t (s)
f (Hz)
a x
L
@ =0.5 (m/s )
2
a x
L
@ =0.5 (m/s /Hz)
2
a x
L
@ =0.75 (m/s )
2
a x
L
@ =0.75 (m/s /Hz)
2
Numerical
Experimental A5
Numerical
Experimental A5
Numerical
Experimental A6
Numerical
Experimental A6
(a)
(c)
(b)
(d)
Fig. 10. (a)–(b) Time history and (c)–(d) frequency content of the acceleration response at sensors
5 and 6 induced by Altaria Talgo VI train. Numerical prediction (black trace) vs. experimental
measurements (red trace). Northbound train (track #2).
for contributions close to the bridge fundamental frequency. This can be associated to
vehicle-structure interaction which is not taken into account and can be of importance,
specially at resonance; or to other energy dissipation mechanisms amplitude dependent
such as the interaction between the adjacent decks, etc.
Figure 11 shows the same type of comparative for the southbound train. In this case
the acceleration is compared at sensors 13 and 17, located at mid-span of the second and
first spans, respectively. Again, the time-history response is well reproduced, specially
after the passage of the locomotive. In the frequency domain again, a predominant peak
is detected showing the important contribution of the fundamental mode with a certain
overprediction of the acceleration in the numerical case.
Finally, the coupling effect between the adjacent decks is evaluated in forced vibration. Figure 12(a)–(c) represent for the northbound train travelling along track #2 the
experimental response measured at sensor 5 (at mid-span under the loaded track) and,
simultaneously, at sensor 17 (at mid-span under the adjacent unloaded track). The transmission of vibrations between the two decks is evident, even though these are only
connected by the continuous ballast layer. At the unloaded sensor the frequency peaks
associated to the excitation (e.g. bogie distance) which are visible in the low frequency