

148
R. Zhang et al.
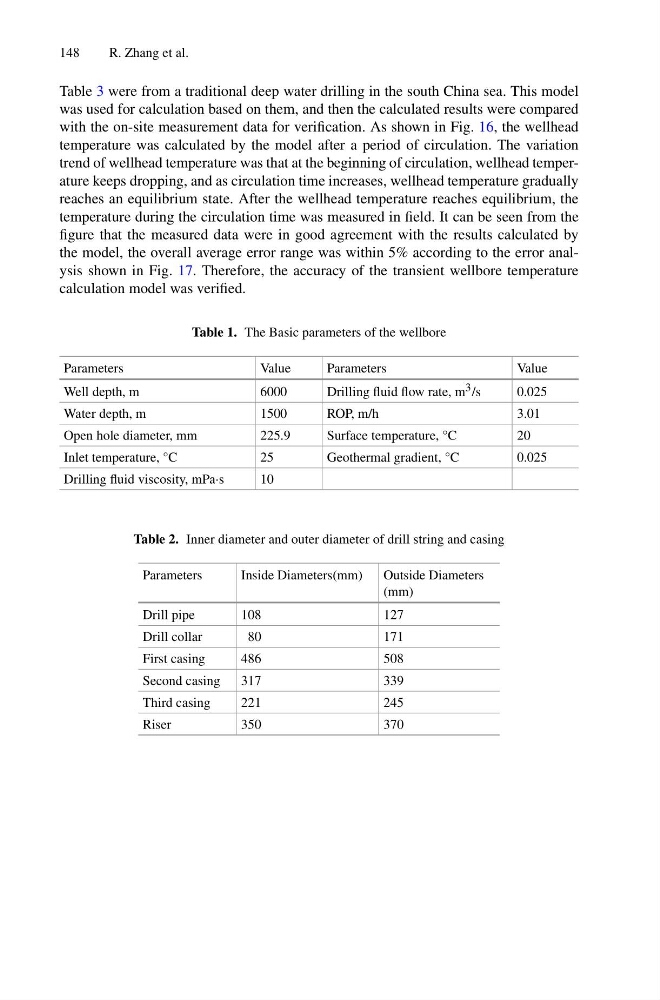
Table 3 were from a traditional deep water drilling in the south China sea. This model
was used for calculation based on them, and then the calculated results were compared
with the on-site measurement data for verification. As shown in Fig. 16, the wellhead
temperature was calculated by the model after a period of circulation. The variation
trend of wellhead temperature was that at the beginning of circulation, wellhead temperature keeps dropping, and as circulation time increases, wellhead temperature gradually
reaches an equilibrium state. After the wellhead temperature reaches equilibrium, the
temperature during the circulation time was measured in field. It can be seen from the
figure that the measured data were in good agreement with the results calculated by
the model, the overall average error range was within 5% according to the error analysis shown in Fig. 17. Therefore, the accuracy of the transient wellbore temperature
calculation model was verified.
Table 1. The Basic parameters of the wellbore
Parameters
Value
Parameters
Value
Well depth, m
6000
Drilling fluid flow rate, m 3 /s
0.025
Water depth, m
1500
ROP, m/h
3.01
Open hole diameter, mm
225.9
Surface temperature, °C
20
Inlet temperature, °C
25
Geothermal gradient, °C
0.025
Drilling fluid viscosity, mPa·s
10
Table 2. Inner diameter and outer diameter of drill string and casing
Parameters
Inside Diameters(mm)
Outside Diameters
(mm)
Drill pipe
108
127
Drill collar
80
171
First casing
486
508
Second casing
317
339
Third casing
221
245
Riser
350
370
R. Zhang et al.
Table 3 were from a traditional deep water drilling in the south China sea. This model
was used for calculation based on them, and then the calculated results were compared
with the on-site measurement data for verification. As shown in Fig. 16, the wellhead
temperature was calculated by the model after a period of circulation. The variation
trend of wellhead temperature was that at the beginning of circulation, wellhead temperature keeps dropping, and as circulation time increases, wellhead temperature gradually
reaches an equilibrium state. After the wellhead temperature reaches equilibrium, the
temperature during the circulation time was measured in field. It can be seen from the
figure that the measured data were in good agreement with the results calculated by
the model, the overall average error range was within 5% according to the error analysis shown in Fig. 17. Therefore, the accuracy of the transient wellbore temperature
calculation model was verified.
Table 1. The Basic parameters of the wellbore
Parameters
Value
Parameters
Value
Well depth, m
6000
Drilling fluid flow rate, m 3 /s
0.025
Water depth, m
1500
ROP, m/h
3.01
Open hole diameter, mm
225.9
Surface temperature, °C
20
Inlet temperature, °C
25
Geothermal gradient, °C
0.025
Drilling fluid viscosity, mPa·s
10
Table 2. Inner diameter and outer diameter of drill string and casing
Parameters
Inside Diameters(mm)
Outside Diameters
(mm)
Drill pipe
108
127
Drill collar
80
171
First casing
486
508
Second casing
317
339
Third casing
221
245
Riser
350
370