

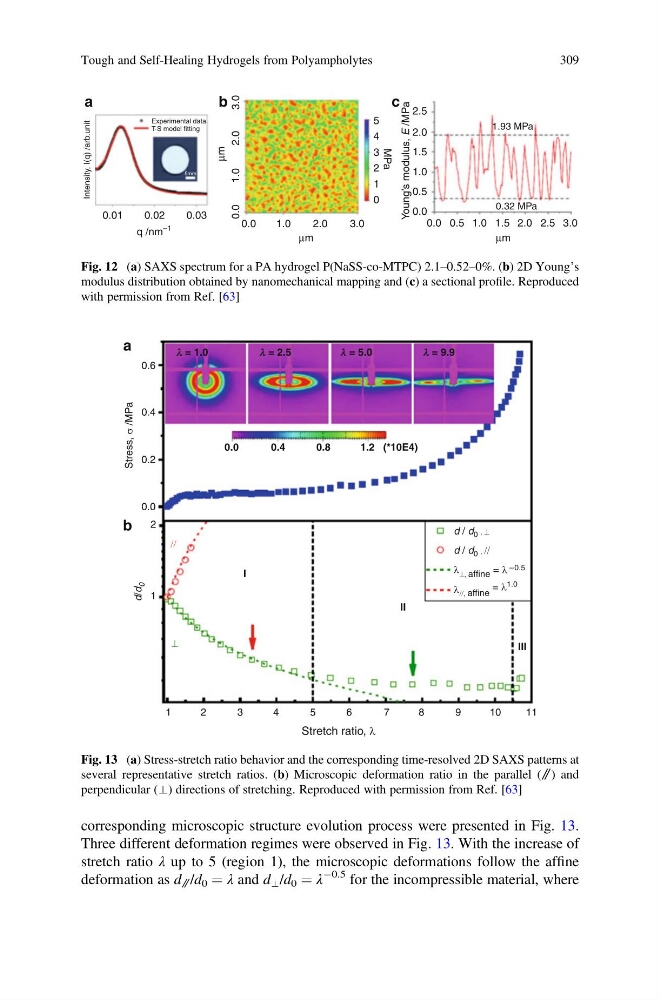
corresponding microscopic structure evolution process were presented in Fig. 13.
Three different deformation regimes were observed in Fig. 13. With the increase of
stretch ratio λ up to 5 (region 1), the microscopic deformations follow the affine
deformation as d ⫽ /d 0 ¼ λ and d ⊥ /d 0 ¼ λ
À0.5 for the incompressible material, where
3.0
2.0
1.0
0.0
0.0
0.01
0.02
Experimental data
T-S model fitting
Intensity, I(q) /arb.unit
0.03
q /nm
–1
μm
μm
μm
1.0
2.0
3.0
2.5
1.93 MPa
2.0
1.5
1.0
Young’s modulus,
E /MPa
0.5
0.0
0.0 0.5 1.0 1.5 2.0 2.5 3.0
0.32 MPa
MPa
0
1
2
3
4
5
c
b
a
5mm
Fig. 12 (a) SAXS spectrum for a PA hydrogel P(NaSS-co-MTPC) 2.1–0.52–0%. (b) 2D Young’s
modulus distribution obtained by nanomechanical mapping and (c) a sectional profile. Reproduced
with permission from Ref. [63]
0.6
a
b
0.4
0.2
0.0
λ λ = 1.0
λ λ = 2.5
λ λ = 5.0
λ = 9.9
Stress,
σ /MPa
0.4
0.8
1.2 (*10E4)
d / d 0 , ⊥
d/d
0
d / d 0 , //
λ ⊥, affine = λ – 0.5
λ //, affine
= λ 1.0
II
I
III
0.0
2
1
1
2
3
4
5
6
7
8
9
1 0
1 1
Stretch ratio, λ
⊥
//
Fig. 13 (a) Stress-stretch ratio behavior and the corresponding time-resolved 2D SAXS patterns at
several representative stretch ratios. (b) Microscopic deformation ratio in the parallel (⫽) and
perpendicular (⊥) directions of stretching. Reproduced with permission from Ref. [63]
Tough and Self-Healing Hydrogels from Polyampholytes
309
Three different deformation regimes were observed in Fig. 13. With the increase of
stretch ratio λ up to 5 (region 1), the microscopic deformations follow the affine
deformation as d ⫽ /d 0 ¼ λ and d ⊥ /d 0 ¼ λ
À0.5 for the incompressible material, where
3.0
2.0
1.0
0.0
0.0
0.01
0.02
Experimental data
T-S model fitting
Intensity, I(q) /arb.unit
0.03
q /nm
–1
μm
μm
μm
1.0
2.0
3.0
2.5
1.93 MPa
2.0
1.5
1.0
Young’s modulus,
E /MPa
0.5
0.0
0.0 0.5 1.0 1.5 2.0 2.5 3.0
0.32 MPa
MPa
0
1
2
3
4
5
c
b
a
5mm
Fig. 12 (a) SAXS spectrum for a PA hydrogel P(NaSS-co-MTPC) 2.1–0.52–0%. (b) 2D Young’s
modulus distribution obtained by nanomechanical mapping and (c) a sectional profile. Reproduced
with permission from Ref. [63]
0.6
a
b
0.4
0.2
0.0
λ λ = 1.0
λ λ = 2.5
λ λ = 5.0
λ = 9.9
Stress,
σ /MPa
0.4
0.8
1.2 (*10E4)
d / d 0 , ⊥
d/d
0
d / d 0 , //
λ ⊥, affine = λ – 0.5
λ //, affine
= λ 1.0
II
I
III
0.0
2
1
1
2
3
4
5
6
7
8
9
1 0
1 1
Stretch ratio, λ
⊥
//
Fig. 13 (a) Stress-stretch ratio behavior and the corresponding time-resolved 2D SAXS patterns at
several representative stretch ratios. (b) Microscopic deformation ratio in the parallel (⫽) and
perpendicular (⊥) directions of stretching. Reproduced with permission from Ref. [63]
Tough and Self-Healing Hydrogels from Polyampholytes
309