

comparable to cartilage and skin, and the values even overlap with those of some
synthetic elastomers.
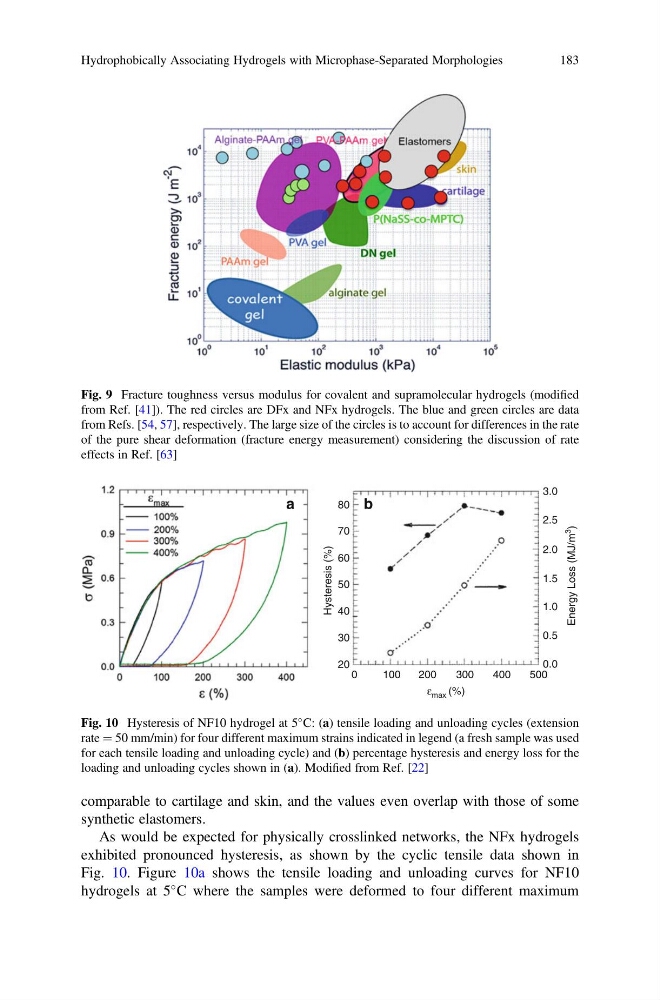
As would be expected for physically crosslinked networks, the NFx hydrogels
exhibited pronounced hysteresis, as shown by the cyclic tensile data shown in
Fig. 10. Figure 10a shows the tensile loading and unloading curves for NF10
hydrogels at 5
C where the samples were deformed to four different maximum
Fig. 9 Fracture toughness versus modulus for covalent and supramolecular hydrogels (modified
from Ref. [41]). The red circles are DFx and NFx hydrogels. The blue and green circles are data
from Refs. [54, 57], respectively. The large size of the circles is to account for differences in the rate
of the pure shear deformation (fracture energy measurement) considering the discussion of rate
effects in Ref. [63]
b
a
80
70
60
50
40
30
20
0
100
200
300
ε max (%)
400
500
0.0
0.5
1.0
Energy Loss (MJ/m
3
)
Hysteresis (%)
1.5
2.0
2.5
3.0
Fig. 10 Hysteresis of NF10 hydrogel at 5
C: (a) tensile loading and unloading cycles (extension
rate ¼ 50 mm/min) for four different maximum strains indicated in legend (a fresh sample was used
for each tensile loading and unloading cycle) and (b) percentage hysteresis and energy loss for the
loading and unloading cycles shown in (a). Modified from Ref. [22]
Hydrophobically Associating Hydrogels with Microphase-Separated Morphologies
183
synthetic elastomers.
As would be expected for physically crosslinked networks, the NFx hydrogels
exhibited pronounced hysteresis, as shown by the cyclic tensile data shown in
Fig. 10. Figure 10a shows the tensile loading and unloading curves for NF10
hydrogels at 5
C where the samples were deformed to four different maximum
Fig. 9 Fracture toughness versus modulus for covalent and supramolecular hydrogels (modified
from Ref. [41]). The red circles are DFx and NFx hydrogels. The blue and green circles are data
from Refs. [54, 57], respectively. The large size of the circles is to account for differences in the rate
of the pure shear deformation (fracture energy measurement) considering the discussion of rate
effects in Ref. [63]
b
a
80
70
60
50
40
30
20
0
100
200
300
ε max (%)
400
500
0.0
0.5
1.0
Energy Loss (MJ/m
3
)
Hysteresis (%)
1.5
2.0
2.5
3.0
Fig. 10 Hysteresis of NF10 hydrogel at 5
C: (a) tensile loading and unloading cycles (extension
rate ¼ 50 mm/min) for four different maximum strains indicated in legend (a fresh sample was used
for each tensile loading and unloading cycle) and (b) percentage hysteresis and energy loss for the
loading and unloading cycles shown in (a). Modified from Ref. [22]
Hydrophobically Associating Hydrogels with Microphase-Separated Morphologies
183