

bridges slowly unbind, allowing the permanent network to relax and the negative
stress to release to some extent.
4.1.6 Entropy-Driven Clustering of Reversible Cross-Links
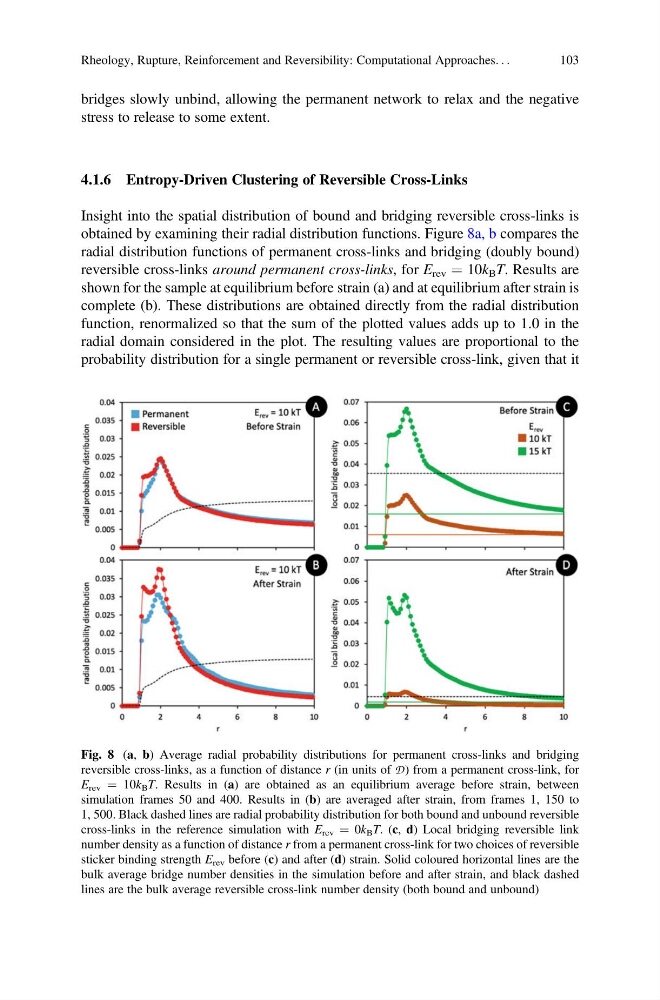
Insight into the spatial distribution of bound and bridging reversible cross-links is
obtained by examining their radial distribution functions. Figure 8a, b compares the
radial distribution functions of permanent cross-links and bridging (doubly bound)
reversible cross-links around permanent cross-links, for E rev ¼ 10k B T. Results are
shown for the sample at equilibrium before strain (a) and at equilibrium after strain is
complete (b). These distributions are obtained directly from the radial distribution
function, renormalized so that the sum of the plotted values adds up to 1.0 in the
radial domain considered in the plot. The resulting values are proportional to the
probability distribution for a single permanent or reversible cross-link, given that it
Fig. 8 (a, b) Average radial probability distributions for permanent cross-links and bridging
reversible cross-links, as a function of distance r (in units of D) from a permanent cross-link, for
E rev ¼ 10k B T. Results in (a) are obtained as an equilibrium average before strain, between
simulation frames 50 and 400. Results in (b) are averaged after strain, from frames 1, 150 to
1, 500. Black dashed lines are radial probability distribution for both bound and unbound reversible
cross-links in the reference simulation with E rev ¼ 0k B T. (c, d) Local bridging reversible link
number density as a function of distance r from a permanent cross-link for two choices of reversible
sticker binding strength E rev before (c) and after (d) strain. Solid coloured horizontal lines are the
bulk average bridge number densities in the simulation before and after strain, and black dashed
lines are the bulk average reversible cross-link number density (both bound and unbound)
Rheology, Rupture, Reinforcement and Reversibility: Computational Approaches. . .
103
stress to release to some extent.
4.1.6 Entropy-Driven Clustering of Reversible Cross-Links
Insight into the spatial distribution of bound and bridging reversible cross-links is
obtained by examining their radial distribution functions. Figure 8a, b compares the
radial distribution functions of permanent cross-links and bridging (doubly bound)
reversible cross-links around permanent cross-links, for E rev ¼ 10k B T. Results are
shown for the sample at equilibrium before strain (a) and at equilibrium after strain is
complete (b). These distributions are obtained directly from the radial distribution
function, renormalized so that the sum of the plotted values adds up to 1.0 in the
radial domain considered in the plot. The resulting values are proportional to the
probability distribution for a single permanent or reversible cross-link, given that it
Fig. 8 (a, b) Average radial probability distributions for permanent cross-links and bridging
reversible cross-links, as a function of distance r (in units of D) from a permanent cross-link, for
E rev ¼ 10k B T. Results in (a) are obtained as an equilibrium average before strain, between
simulation frames 50 and 400. Results in (b) are averaged after strain, from frames 1, 150 to
1, 500. Black dashed lines are radial probability distribution for both bound and unbound reversible
cross-links in the reference simulation with E rev ¼ 0k B T. (c, d) Local bridging reversible link
number density as a function of distance r from a permanent cross-link for two choices of reversible
sticker binding strength E rev before (c) and after (d) strain. Solid coloured horizontal lines are the
bulk average bridge number densities in the simulation before and after strain, and black dashed
lines are the bulk average reversible cross-link number density (both bound and unbound)
Rheology, Rupture, Reinforcement and Reversibility: Computational Approaches. . .
103