

302
R. J. Casperson
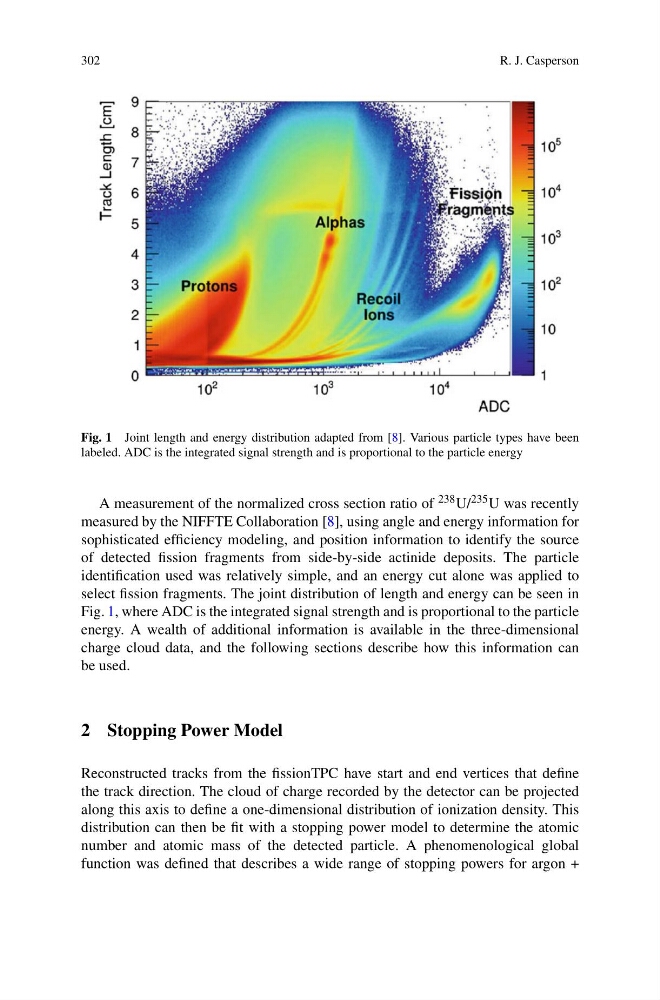
Fig. 1 Joint length and energy distribution adapted from [8]. Various particle types have been
labeled. ADC is the integrated signal strength and is proportional to the particle energy
A measurement of the normalized cross section ratio of 238 U/ 235 U was recently
measured by the NIFFTE Collaboration [8], using angle and energy information for
sophisticated efficiency modeling, and position information to identify the source
of detected fission fragments from side-by-side actinide deposits. The particle
identification used was relatively simple, and an energy cut alone was applied to
select fission fragments. The joint distribution of length and energy can be seen in
Fig. 1, where ADC is the integrated signal strength and is proportional to the particle
energy. A wealth of additional information is available in the three-dimensional
charge cloud data, and the following sections describe how this information can
be used.
2 Stopping Power Model
Reconstructed tracks from the fissionTPC have start and end vertices that define
the track direction. The cloud of charge recorded by the detector can be projected
along this axis to define a one-dimensional distribution of ionization density. This
distribution can then be fit with a stopping power model to determine the atomic
number and atomic mass of the detected particle. A phenomenological global
function was defined that describes a wide range of stopping powers for argon +
R. J. Casperson
Fig. 1 Joint length and energy distribution adapted from [8]. Various particle types have been
labeled. ADC is the integrated signal strength and is proportional to the particle energy
A measurement of the normalized cross section ratio of 238 U/ 235 U was recently
measured by the NIFFTE Collaboration [8], using angle and energy information for
sophisticated efficiency modeling, and position information to identify the source
of detected fission fragments from side-by-side actinide deposits. The particle
identification used was relatively simple, and an energy cut alone was applied to
select fission fragments. The joint distribution of length and energy can be seen in
Fig. 1, where ADC is the integrated signal strength and is proportional to the particle
energy. A wealth of additional information is available in the three-dimensional
charge cloud data, and the following sections describe how this information can
be used.
2 Stopping Power Model
Reconstructed tracks from the fissionTPC have start and end vertices that define
the track direction. The cloud of charge recorded by the detector can be projected
along this axis to define a one-dimensional distribution of ionization density. This
distribution can then be fit with a stopping power model to determine the atomic
number and atomic mass of the detected particle. A phenomenological global
function was defined that describes a wide range of stopping powers for argon +