

Attempting to Close the Loop on the Oslo Technique at 198 Au: Constraining. . .
189
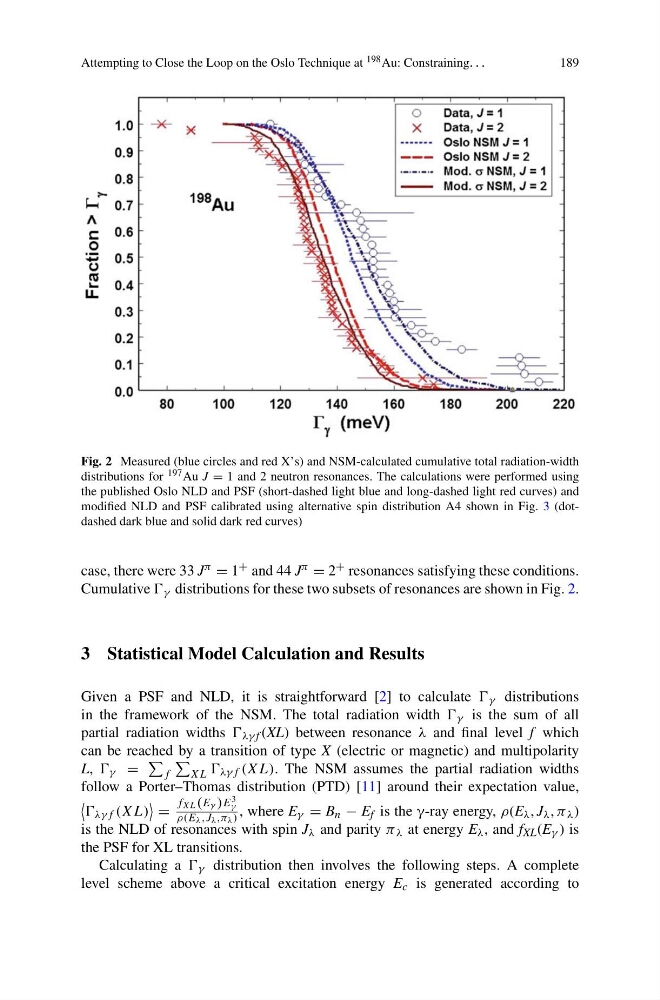
Fig. 2 Measured (blue circles and red X’s) and NSM-calculated cumulative total radiation-width
distributions for 197 Au J = 1 and 2 neutron resonances. The calculations were performed using
the published Oslo NLD and PSF (short-dashed light blue and long-dashed light red curves) and
modified NLD and PSF calibrated using alternative spin distribution A4 shown in Fig. 3 (dotdashed dark blue and solid dark red curves)
case, there were 33 J π = 1 + and 44 J π = 2 + resonances satisfying these conditions.
Cumulative γ distributions for these two subsets of resonances are shown in Fig. 2.
3 Statistical Model Calculation and Results
Given a PSF and NLD, it is straightforward [2] to calculate γ distributions
in the framework of the NSM. The total radiation width γ is the sum of all
partial radiation widths λγ f (XL) between resonance λ and final level f which
can be reached by a transition of type X (electric or magnetic) and multipolarity
L, γ =
f
XL λγf (XL). The NSM assumes the partial radiation widths
follow a Porter–Thomas distribution (PTD) [11] around their expectation value,
λγf (XL)
=
f XL( E γ )E
3
γ
ρ(E λ ,J λ ,π λ ) , where E γ = B n − E f is the γ-ray energy, ρ(E λ , J λ , π λ )
is the NLD of resonances with spin J λ and parity π λ at energy E λ , and f XL (E γ ) is
the PSF for XL transitions.
Calculating a γ distribution then involves the following steps. A complete
level scheme above a critical excitation energy E c is generated according to
189
Fig. 2 Measured (blue circles and red X’s) and NSM-calculated cumulative total radiation-width
distributions for 197 Au J = 1 and 2 neutron resonances. The calculations were performed using
the published Oslo NLD and PSF (short-dashed light blue and long-dashed light red curves) and
modified NLD and PSF calibrated using alternative spin distribution A4 shown in Fig. 3 (dotdashed dark blue and solid dark red curves)
case, there were 33 J π = 1 + and 44 J π = 2 + resonances satisfying these conditions.
Cumulative γ distributions for these two subsets of resonances are shown in Fig. 2.
3 Statistical Model Calculation and Results
Given a PSF and NLD, it is straightforward [2] to calculate γ distributions
in the framework of the NSM. The total radiation width γ is the sum of all
partial radiation widths λγ f (XL) between resonance λ and final level f which
can be reached by a transition of type X (electric or magnetic) and multipolarity
L, γ =
f
XL λγf (XL). The NSM assumes the partial radiation widths
follow a Porter–Thomas distribution (PTD) [11] around their expectation value,
λγf (XL)
=
f XL( E γ )E
3
γ
ρ(E λ ,J λ ,π λ ) , where E γ = B n − E f is the γ-ray energy, ρ(E λ , J λ , π λ )
is the NLD of resonances with spin J λ and parity π λ at energy E λ , and f XL (E γ ) is
the PSF for XL transitions.
Calculating a γ distribution then involves the following steps. A complete
level scheme above a critical excitation energy E c is generated according to