

Nuclear Level Densities
107
0 4 8 12
1
10
3
10
6
10
9
ρ(E
x
) (MeV
-1
)
4 8 12
4 8 12
4 8 12
4 8 12
E x (MeV)
1
10
3
10
6
10
9
144 Nd
146 Nd
148
Nd
150 Nd
152
Nd
148 Sm
150 Sm
152
Sm
154 Sm
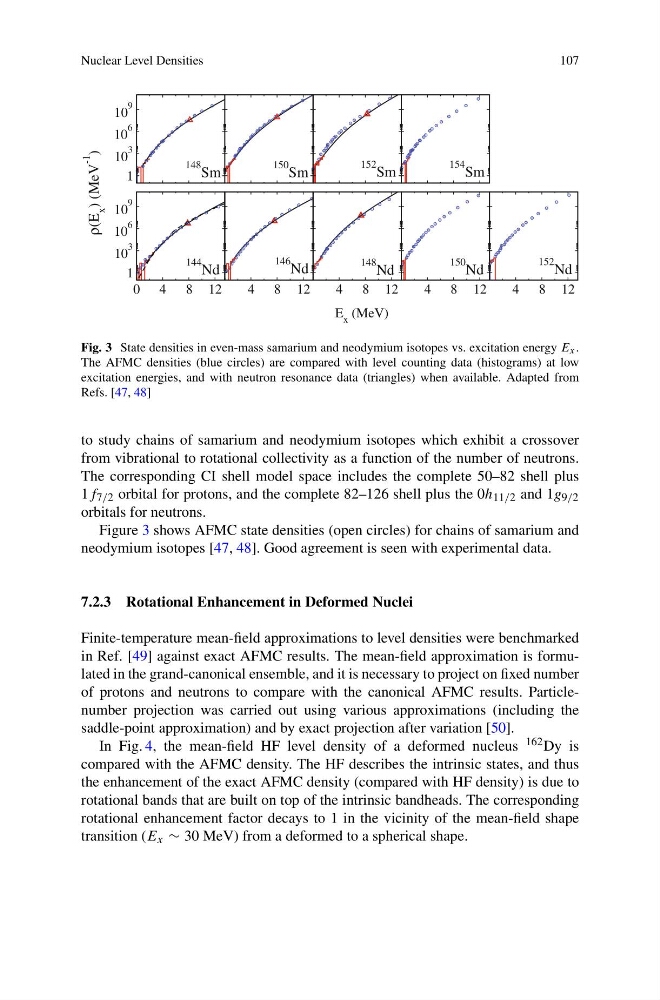
Fig. 3 State densities in even-mass samarium and neodymium isotopes vs. excitation energy E x .
The AFMC densities (blue circles) are compared with level counting data (histograms) at low
excitation energies, and with neutron resonance data (triangles) when available. Adapted from
Refs. [47, 48]
to study chains of samarium and neodymium isotopes which exhibit a crossover
from vibrational to rotational collectivity as a function of the number of neutrons.
The corresponding CI shell model space includes the complete 50–82 shell plus
1f 7/2 orbital for protons, and the complete 82–126 shell plus the 0h 11/2 and 1g 9/2
orbitals for neutrons.
Figure 3 shows AFMC state densities (open circles) for chains of samarium and
neodymium isotopes [47, 48]. Good agreement is seen with experimental data.
7.2.3 Rotational Enhancement in Deformed Nuclei
Finite-temperature mean-field approximations to level densities were benchmarked
in Ref. [49] against exact AFMC results. The mean-field approximation is formulated in the grand-canonical ensemble, and it is necessary to project on fixed number
of protons and neutrons to compare with the canonical AFMC results. Particlenumber projection was carried out using various approximations (including the
saddle-point approximation) and by exact projection after variation [50].
In Fig. 4, the mean-field HF level density of a deformed nucleus 162 Dy is
compared with the AFMC density. The HF describes the intrinsic states, and thus
the enhancement of the exact AFMC density (compared with HF density) is due to
rotational bands that are built on top of the intrinsic bandheads. The corresponding
rotational enhancement factor decays to 1 in the vicinity of the mean-field shape
transition (E x ∼ 30 MeV) from a deformed to a spherical shape.
107
0 4 8 12
1
10
3
10
6
10
9
ρ(E
x
) (MeV
-1
)
4 8 12
4 8 12
4 8 12
4 8 12
E x (MeV)
1
10
3
10
6
10
9
144 Nd
146 Nd
148
Nd
150 Nd
152
Nd
148 Sm
150 Sm
152
Sm
154 Sm
Fig. 3 State densities in even-mass samarium and neodymium isotopes vs. excitation energy E x .
The AFMC densities (blue circles) are compared with level counting data (histograms) at low
excitation energies, and with neutron resonance data (triangles) when available. Adapted from
Refs. [47, 48]
to study chains of samarium and neodymium isotopes which exhibit a crossover
from vibrational to rotational collectivity as a function of the number of neutrons.
The corresponding CI shell model space includes the complete 50–82 shell plus
1f 7/2 orbital for protons, and the complete 82–126 shell plus the 0h 11/2 and 1g 9/2
orbitals for neutrons.
Figure 3 shows AFMC state densities (open circles) for chains of samarium and
neodymium isotopes [47, 48]. Good agreement is seen with experimental data.
7.2.3 Rotational Enhancement in Deformed Nuclei
Finite-temperature mean-field approximations to level densities were benchmarked
in Ref. [49] against exact AFMC results. The mean-field approximation is formulated in the grand-canonical ensemble, and it is necessary to project on fixed number
of protons and neutrons to compare with the canonical AFMC results. Particlenumber projection was carried out using various approximations (including the
saddle-point approximation) and by exact projection after variation [50].
In Fig. 4, the mean-field HF level density of a deformed nucleus 162 Dy is
compared with the AFMC density. The HF describes the intrinsic states, and thus
the enhancement of the exact AFMC density (compared with HF density) is due to
rotational bands that are built on top of the intrinsic bandheads. The corresponding
rotational enhancement factor decays to 1 in the vicinity of the mean-field shape
transition (E x ∼ 30 MeV) from a deformed to a spherical shape.