

92
C. Neugebauer et al.
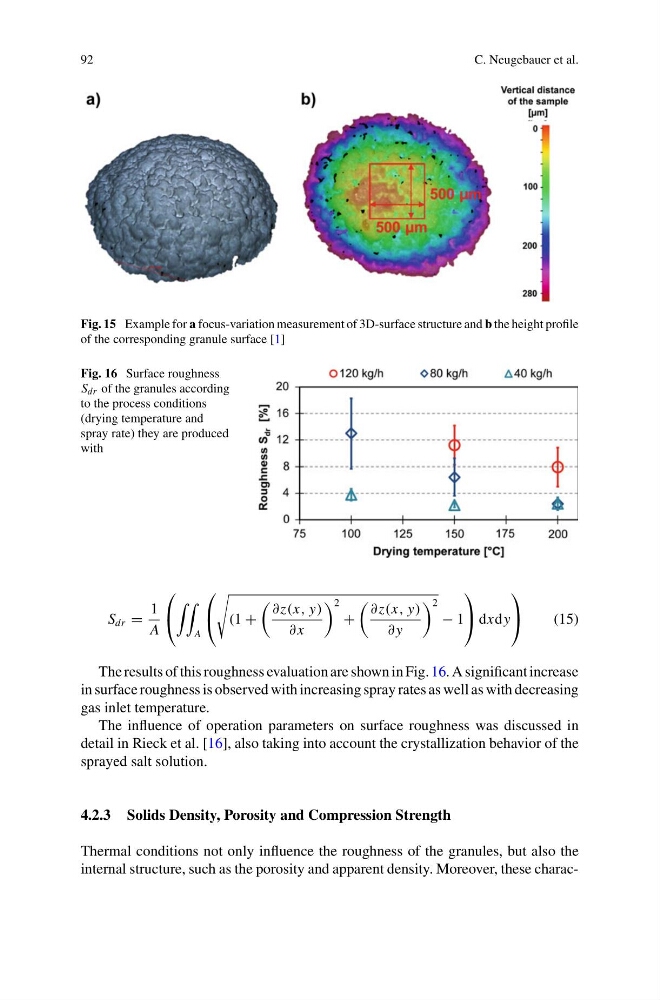
Fig. 15 Example for a focus-variation measurement of 3D-surface structure and b the height profile
of the corresponding granule surface [1]
Fig. 16 Surface roughness
S dr of the granules according
to the process conditions
(drying temperature and
spray rate) they are produced
with
S dr =
1
A
⎛
⎝
A
⎛
⎝
(1 +
∂z(x, y)
∂ x
2
+
∂z(x, y)
∂ y
2
− 1
⎞
⎠ dxdy
⎞
⎠
(15)
The results of this roughness evaluation are shown in Fig. 16. A significant increase
in surface roughness is observed with increasing spray rates as well as with decreasing
gas inlet temperature.
The influence of operation parameters on surface roughness was discussed in
detail in Rieck et al. [16], also taking into account the crystallization behavior of the
sprayed salt solution.
4.2.3 Solids Density, Porosity and Compression Strength
Thermal conditions not only influence the roughness of the granules, but also the
internal structure, such as the porosity and apparent density. Moreover, these charac-
C. Neugebauer et al.
Fig. 15 Example for a focus-variation measurement of 3D-surface structure and b the height profile
of the corresponding granule surface [1]
Fig. 16 Surface roughness
S dr of the granules according
to the process conditions
(drying temperature and
spray rate) they are produced
with
S dr =
1
A
⎛
⎝
A
⎛
⎝
(1 +
∂z(x, y)
∂ x
2
+
∂z(x, y)
∂ y
2
− 1
⎞
⎠ dxdy
⎞
⎠
(15)
The results of this roughness evaluation are shown in Fig. 16. A significant increase
in surface roughness is observed with increasing spray rates as well as with decreasing
gas inlet temperature.
The influence of operation parameters on surface roughness was discussed in
detail in Rieck et al. [16], also taking into account the crystallization behavior of the
sprayed salt solution.
4.2.3 Solids Density, Porosity and Compression Strength
Thermal conditions not only influence the roughness of the granules, but also the
internal structure, such as the porosity and apparent density. Moreover, these charac-