

82
C. Neugebauer et al.
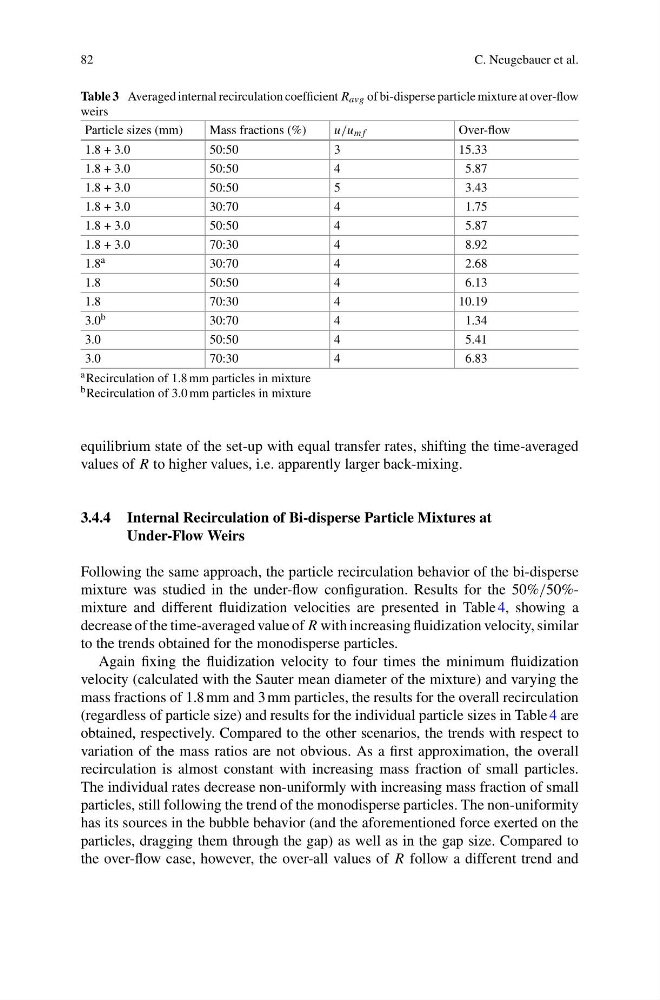
Table 3 Averaged internal recirculation coefficient R avg of bi-disperse particle mixture at over-flow
weirs
Particle sizes (mm)
Mass fractions (%)
u/u m f
Over-flow
1.8 + 3.0
50:50
3
15.33
1.8 + 3.0
50:50
4
5.87
1.8 + 3.0
50:50
5
3.43
1.8 + 3.0
30:70
4
1.75
1.8 + 3.0
50:50
4
5.87
1.8 + 3.0
70:30
4
8.92
1.8 a
30:70
4
2.68
1.8
50:50
4
6.13
1.8
70:30
4
10.19
3.0 b
30:70
4
1.34
3.0
50:50
4
5.41
3.0
70:30
4
6.83
a Recirculation of 1.8 mm particles in mixture
b Recirculation of 3.0 mm particles in mixture
equilibrium state of the set-up with equal transfer rates, shifting the time-averaged
values of R to higher values, i.e. apparently larger back-mixing.
3.4.4 Internal Recirculation of Bi-disperse Particle Mixtures at
Under-Flow Weirs
Following the same approach, the particle recirculation behavior of the bi-disperse
mixture was studied in the under-flow configuration. Results for the 50%/50%mixture and different fluidization velocities are presented in Table 4, showing a
decrease of the time-averaged value of R with increasing fluidization velocity, similar
to the trends obtained for the monodisperse particles.
Again fixing the fluidization velocity to four times the minimum fluidization
velocity (calculated with the Sauter mean diameter of the mixture) and varying the
mass fractions of 1.8 mm and 3 mm particles, the results for the overall recirculation
(regardless of particle size) and results for the individual particle sizes in Table 4 are
obtained, respectively. Compared to the other scenarios, the trends with respect to
variation of the mass ratios are not obvious. As a first approximation, the overall
recirculation is almost constant with increasing mass fraction of small particles.
The individual rates decrease non-uniformly with increasing mass fraction of small
particles, still following the trend of the monodisperse particles. The non-uniformity
has its sources in the bubble behavior (and the aforementioned force exerted on the
particles, dragging them through the gap) as well as in the gap size. Compared to
the over-flow case, however, the over-all values of R follow a different trend and
C. Neugebauer et al.
Table 3 Averaged internal recirculation coefficient R avg of bi-disperse particle mixture at over-flow
weirs
Particle sizes (mm)
Mass fractions (%)
u/u m f
Over-flow
1.8 + 3.0
50:50
3
15.33
1.8 + 3.0
50:50
4
5.87
1.8 + 3.0
50:50
5
3.43
1.8 + 3.0
30:70
4
1.75
1.8 + 3.0
50:50
4
5.87
1.8 + 3.0
70:30
4
8.92
1.8 a
30:70
4
2.68
1.8
50:50
4
6.13
1.8
70:30
4
10.19
3.0 b
30:70
4
1.34
3.0
50:50
4
5.41
3.0
70:30
4
6.83
a Recirculation of 1.8 mm particles in mixture
b Recirculation of 3.0 mm particles in mixture
equilibrium state of the set-up with equal transfer rates, shifting the time-averaged
values of R to higher values, i.e. apparently larger back-mixing.
3.4.4 Internal Recirculation of Bi-disperse Particle Mixtures at
Under-Flow Weirs
Following the same approach, the particle recirculation behavior of the bi-disperse
mixture was studied in the under-flow configuration. Results for the 50%/50%mixture and different fluidization velocities are presented in Table 4, showing a
decrease of the time-averaged value of R with increasing fluidization velocity, similar
to the trends obtained for the monodisperse particles.
Again fixing the fluidization velocity to four times the minimum fluidization
velocity (calculated with the Sauter mean diameter of the mixture) and varying the
mass fractions of 1.8 mm and 3 mm particles, the results for the overall recirculation
(regardless of particle size) and results for the individual particle sizes in Table 4 are
obtained, respectively. Compared to the other scenarios, the trends with respect to
variation of the mass ratios are not obvious. As a first approximation, the overall
recirculation is almost constant with increasing mass fraction of small particles.
The individual rates decrease non-uniformly with increasing mass fraction of small
particles, still following the trend of the monodisperse particles. The non-uniformity
has its sources in the bubble behavior (and the aforementioned force exerted on the
particles, dragging them through the gap) as well as in the gap size. Compared to
the over-flow case, however, the over-all values of R follow a different trend and