

80
C. Neugebauer et al.
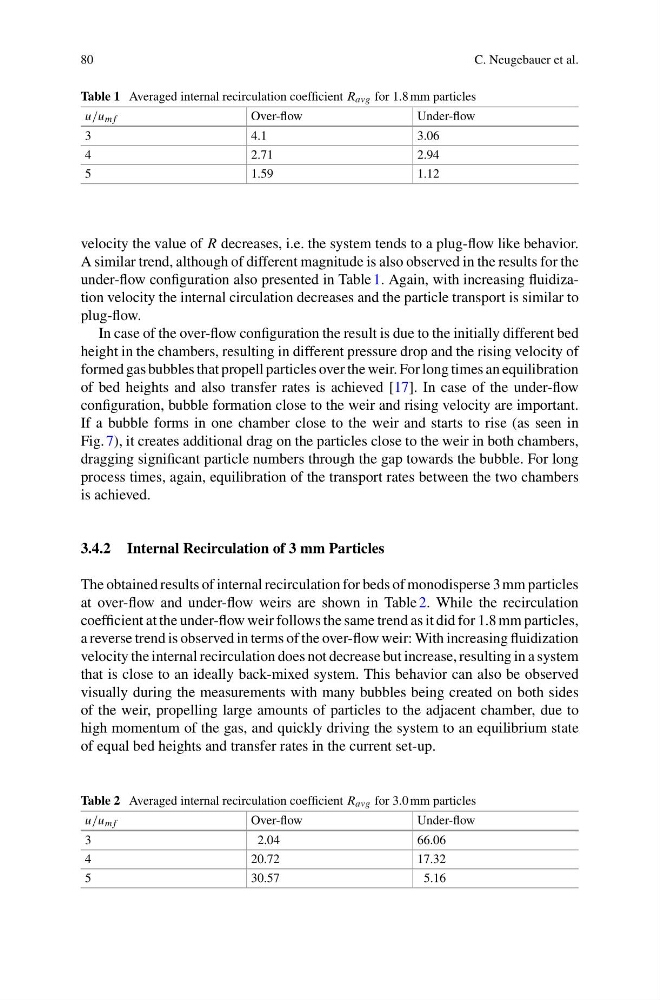
Table 1 Averaged internal recirculation coefficient R avg for 1.8 mm particles
u/u m f
Over-flow
Under-flow
3
4.1
3.06
4
2.71
2.94
5
1.59
1.12
velocity the value of R decreases, i.e. the system tends to a plug-flow like behavior.
A similar trend, although of different magnitude is also observed in the results for the
under-flow configuration also presented in Table 1. Again, with increasing fluidization velocity the internal circulation decreases and the particle transport is similar to
plug-flow.
In case of the over-flow configuration the result is due to the initially different bed
height in the chambers, resulting in different pressure drop and the rising velocity of
formed gas bubbles that propell particles over the weir. For long times an equilibration
of bed heights and also transfer rates is achieved [17]. In case of the under-flow
configuration, bubble formation close to the weir and rising velocity are important.
If a bubble forms in one chamber close to the weir and starts to rise (as seen in
Fig. 7), it creates additional drag on the particles close to the weir in both chambers,
dragging significant particle numbers through the gap towards the bubble. For long
process times, again, equilibration of the transport rates between the two chambers
is achieved.
3.4.2 Internal Recirculation of 3 mm Particles
The obtained results of internal recirculation for beds of monodisperse 3 mm particles
at over-flow and under-flow weirs are shown in Table 2. While the recirculation
coefficient at the under-flow weir follows the same trend as it did for 1.8 mm particles,
a reverse trend is observed in terms of the over-flow weir: With increasing fluidization
velocity the internal recirculation does not decrease but increase, resulting in a system
that is close to an ideally back-mixed system. This behavior can also be observed
visually during the measurements with many bubbles being created on both sides
of the weir, propelling large amounts of particles to the adjacent chamber, due to
high momentum of the gas, and quickly driving the system to an equilibrium state
of equal bed heights and transfer rates in the current set-up.
Table 2 Averaged internal recirculation coefficient R avg for 3.0 mm particles
u/u m f
Over-flow
Under-flow
3
2.04
66.06
4
20.72
17.32
5
30.57
5.16
C. Neugebauer et al.
Table 1 Averaged internal recirculation coefficient R avg for 1.8 mm particles
u/u m f
Over-flow
Under-flow
3
4.1
3.06
4
2.71
2.94
5
1.59
1.12
velocity the value of R decreases, i.e. the system tends to a plug-flow like behavior.
A similar trend, although of different magnitude is also observed in the results for the
under-flow configuration also presented in Table 1. Again, with increasing fluidization velocity the internal circulation decreases and the particle transport is similar to
plug-flow.
In case of the over-flow configuration the result is due to the initially different bed
height in the chambers, resulting in different pressure drop and the rising velocity of
formed gas bubbles that propell particles over the weir. For long times an equilibration
of bed heights and also transfer rates is achieved [17]. In case of the under-flow
configuration, bubble formation close to the weir and rising velocity are important.
If a bubble forms in one chamber close to the weir and starts to rise (as seen in
Fig. 7), it creates additional drag on the particles close to the weir in both chambers,
dragging significant particle numbers through the gap towards the bubble. For long
process times, again, equilibration of the transport rates between the two chambers
is achieved.
3.4.2 Internal Recirculation of 3 mm Particles
The obtained results of internal recirculation for beds of monodisperse 3 mm particles
at over-flow and under-flow weirs are shown in Table 2. While the recirculation
coefficient at the under-flow weir follows the same trend as it did for 1.8 mm particles,
a reverse trend is observed in terms of the over-flow weir: With increasing fluidization
velocity the internal recirculation does not decrease but increase, resulting in a system
that is close to an ideally back-mixed system. This behavior can also be observed
visually during the measurements with many bubbles being created on both sides
of the weir, propelling large amounts of particles to the adjacent chamber, due to
high momentum of the gas, and quickly driving the system to an equilibrium state
of equal bed heights and transfer rates in the current set-up.
Table 2 Averaged internal recirculation coefficient R avg for 3.0 mm particles
u/u m f
Over-flow
Under-flow
3
2.04
66.06
4
20.72
17.32
5
30.57
5.16