

572
M. Spinola et al.
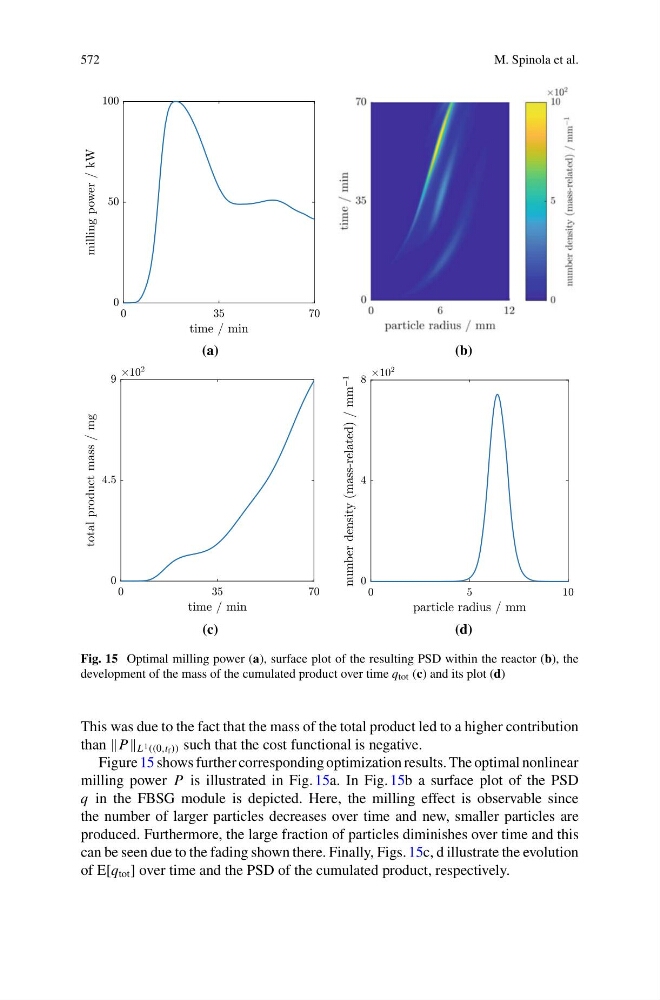
Fig. 15 Optimal milling power (a), surface plot of the resulting PSD within the reactor (b), the
development of the mass of the cumulated product over time q tot (c) and its plot (d)
This was due to the fact that the mass of the total product led to a higher contribution
than L 1 ((0,t f )) such that the cost functional is negative.
Figure 15 shows further corresponding optimization results. The optimal nonlinear
milling power P is illustrated in Fig. 15a. In Fig. 15b a surface plot of the PSD
q in the FBSG module is depicted. Here, the milling effect is observable since
the number of larger particles decreases over time and new, smaller particles are
produced. Furthermore, the large fraction of particles diminishes over time and this
can be seen due to the fading shown there. Finally, Figs. 15c, d illustrate the evolution
of E[q tot ] over time and the PSD of the cumulated product, respectively.
M. Spinola et al.
Fig. 15 Optimal milling power (a), surface plot of the resulting PSD within the reactor (b), the
development of the mass of the cumulated product over time q tot (c) and its plot (d)
This was due to the fact that the mass of the total product led to a higher contribution
than L 1 ((0,t f )) such that the cost functional is negative.
Figure 15 shows further corresponding optimization results. The optimal nonlinear
milling power P is illustrated in Fig. 15a. In Fig. 15b a surface plot of the PSD
q in the FBSG module is depicted. Here, the milling effect is observable since
the number of larger particles decreases over time and new, smaller particles are
produced. Furthermore, the large fraction of particles diminishes over time and this
can be seen due to the fading shown there. Finally, Figs. 15c, d illustrate the evolution
of E[q tot ] over time and the PSD of the cumulated product, respectively.