

2 Dynamic Modelling of Reactive Fluidized Bed Systems Using …
45
suspension
phase
bubble phase
gas convection
gas diffusion
C d,l
C b,l
C f, l
perfectly
mixed solids
perfectly
mixed solids
m OC, out
X OC, out
mOC, out
X OC, out
m OC, in
X OC, in
mgas, out
C l, out
u d
C d,i, in
u b
C b,i, in
.
.
.
.
solids free
freeboard
reaction
reaction
dense
bottom
zone
dilute
upper
zone
height above gas distributor h
h max
H bed
solids concentration c v
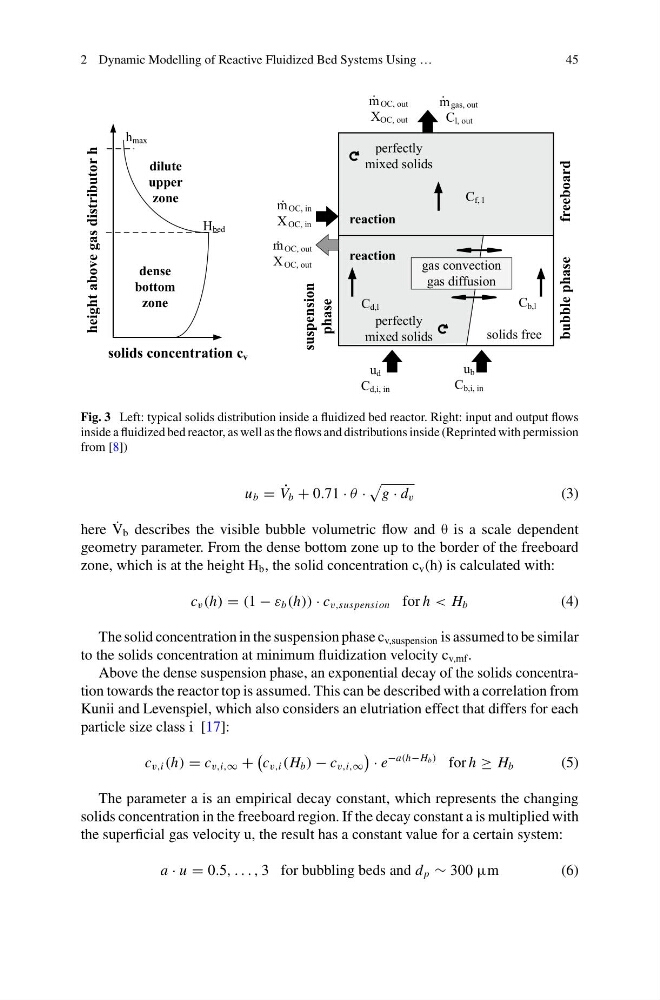
Fig. 3 Left: typical solids distribution inside a fluidized bed reactor. Right: input and output flows
inside a fluidized bed reactor, as well as the flows and distributions inside (Reprinted with permission
from [8])
u b = ˙
V b + 0.71 · θ ·
g · d v
(3)
here ˙
V b describes the visible bubble volumetric flow and θ is a scale dependent
geometry parameter. From the dense bottom zone up to the border of the freeboard
zone, which is at the height H b , the solid concentration c v (h) is calculated with:
c v (h) = (1 − ε b (h)) · c v,suspension for h < H b
(4)
The solid concentration in the suspension phase c v,suspension is assumed to be similar
to the solids concentration at minimum fluidization velocity c v,mf .
Above the dense suspension phase, an exponential decay of the solids concentration towards the reactor top is assumed. This can be described with a correlation from
Kunii and Levenspiel, which also considers an elutriation effect that differs for each
particle size class i [17]:
c v,i (h) = c v,i,∞ +
c v,i (H b ) − c v,i,∞
· e
−a(h−H b ) for h ≥ H b
(5)
The parameter a is an empirical decay constant, which represents the changing
solids concentration in the freeboard region. If the decay constant a is multiplied with
the superficial gas velocity u, the result has a constant value for a certain system:
a · u = 0.5, . . . , 3 for bubbling beds and d p ∼ 300 μm
( 6 )
45
suspension
phase
bubble phase
gas convection
gas diffusion
C d,l
C b,l
C f, l
perfectly
mixed solids
perfectly
mixed solids
m OC, out
X OC, out
mOC, out
X OC, out
m OC, in
X OC, in
mgas, out
C l, out
u d
C d,i, in
u b
C b,i, in
.
.
.
.
solids free
freeboard
reaction
reaction
dense
bottom
zone
dilute
upper
zone
height above gas distributor h
h max
H bed
solids concentration c v
Fig. 3 Left: typical solids distribution inside a fluidized bed reactor. Right: input and output flows
inside a fluidized bed reactor, as well as the flows and distributions inside (Reprinted with permission
from [8])
u b = ˙
V b + 0.71 · θ ·
g · d v
(3)
here ˙
V b describes the visible bubble volumetric flow and θ is a scale dependent
geometry parameter. From the dense bottom zone up to the border of the freeboard
zone, which is at the height H b , the solid concentration c v (h) is calculated with:
c v (h) = (1 − ε b (h)) · c v,suspension for h < H b
(4)
The solid concentration in the suspension phase c v,suspension is assumed to be similar
to the solids concentration at minimum fluidization velocity c v,mf .
Above the dense suspension phase, an exponential decay of the solids concentration towards the reactor top is assumed. This can be described with a correlation from
Kunii and Levenspiel, which also considers an elutriation effect that differs for each
particle size class i [17]:
c v,i (h) = c v,i,∞ +
c v,i (H b ) − c v,i,∞
· e
−a(h−H b ) for h ≥ H b
(5)
The parameter a is an empirical decay constant, which represents the changing
solids concentration in the freeboard region. If the decay constant a is multiplied with
the superficial gas velocity u, the result has a constant value for a certain system:
a · u = 0.5, . . . , 3 for bubbling beds and d p ∼ 300 μm
( 6 )