

10 Dynamics of Separation Characteristics of Sieving and Flow …
385
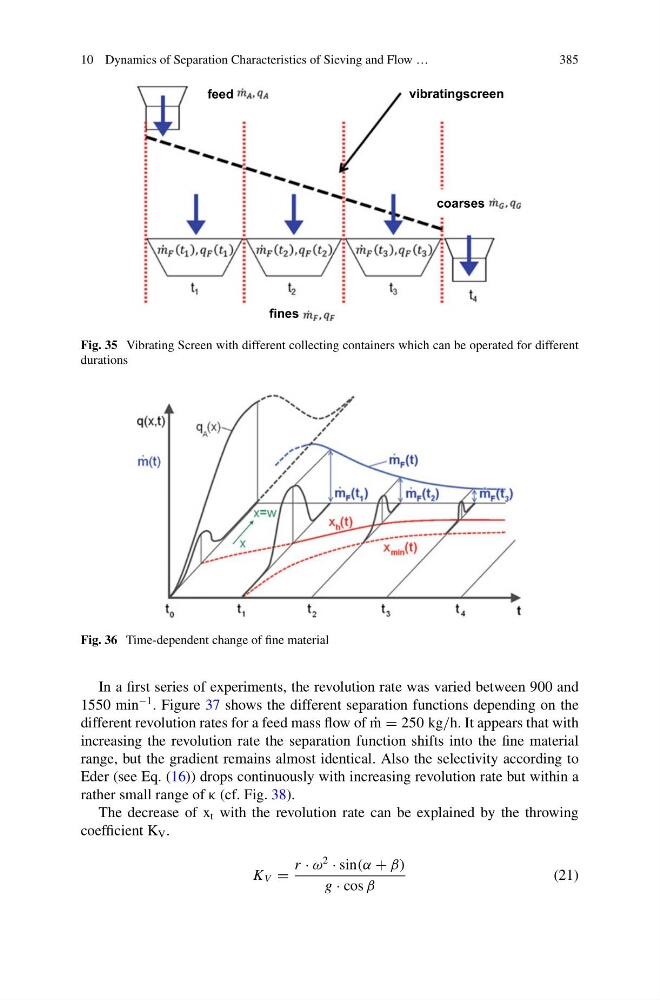
feed
fines
coarses
vibratingscreen
Fig. 35 Vibrating Screen with different collecting containers which can be operated for different
durations
Fig. 36 Time-dependent change of fine material
In a first series of experiments, the revolution rate was varied between 900 and
1550 min
−1 . Figure 37 shows the different separation functions depending on the
different revolution rates for a feed mass flow of ˙
m = 250 kg/h. It appears that with
increasing the revolution rate the separation function shifts into the fine material
range, but the gradient remains almost identical. Also the selectivity according to
Eder (see Eq. (16)) drops continuously with increasing revolution rate but within a
rather small range of κ (cf. Fig. 38).
The decrease of x t with the revolution rate can be explained by the throwing
coefficient K V .
K V =
r · ω
2
· sin(α + β)
g · cos β
(21)
385
feed
fines
coarses
vibratingscreen
Fig. 35 Vibrating Screen with different collecting containers which can be operated for different
durations
Fig. 36 Time-dependent change of fine material
In a first series of experiments, the revolution rate was varied between 900 and
1550 min
−1 . Figure 37 shows the different separation functions depending on the
different revolution rates for a feed mass flow of ˙
m = 250 kg/h. It appears that with
increasing the revolution rate the separation function shifts into the fine material
range, but the gradient remains almost identical. Also the selectivity according to
Eder (see Eq. (16)) drops continuously with increasing revolution rate but within a
rather small range of κ (cf. Fig. 38).
The decrease of x t with the revolution rate can be explained by the throwing
coefficient K V .
K V =
r · ω
2
· sin(α + β)
g · cos β
(21)