

10 Dynamics of Separation Characteristics of Sieving and Flow …
363
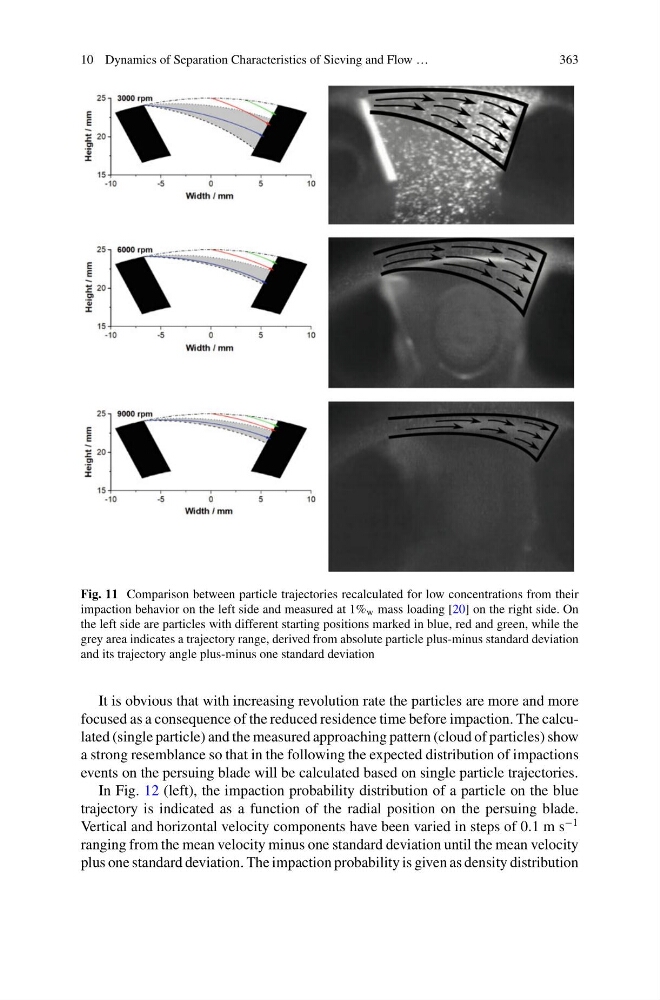
Fig. 11 Comparison between particle trajectories recalculated for low concentrations from their
impaction behavior on the left side and measured at 1% w mass loading [20] on the right side. On
the left side are particles with different starting positions marked in blue, red and green, while the
grey area indicates a trajectory range, derived from absolute particle plus-minus standard deviation
and its trajectory angle plus-minus one standard deviation
It is obvious that with increasing revolution rate the particles are more and more
focused as a consequence of the reduced residence time before impaction. The calculated (single particle) and the measured approaching pattern (cloud of particles) show
a strong resemblance so that in the following the expected distribution of impactions
events on the persuing blade will be calculated based on single particle trajectories.
In Fig. 12 (left), the impaction probability distribution of a particle on the blue
trajectory is indicated as a function of the radial position on the persuing blade.
Vertical and horizontal velocity components have been varied in steps of 0.1 m s
−1
ranging from the mean velocity minus one standard deviation until the mean velocity
plus one standard deviation. The impaction probability is given as density distribution
363
Fig. 11 Comparison between particle trajectories recalculated for low concentrations from their
impaction behavior on the left side and measured at 1% w mass loading [20] on the right side. On
the left side are particles with different starting positions marked in blue, red and green, while the
grey area indicates a trajectory range, derived from absolute particle plus-minus standard deviation
and its trajectory angle plus-minus one standard deviation
It is obvious that with increasing revolution rate the particles are more and more
focused as a consequence of the reduced residence time before impaction. The calculated (single particle) and the measured approaching pattern (cloud of particles) show
a strong resemblance so that in the following the expected distribution of impactions
events on the persuing blade will be calculated based on single particle trajectories.
In Fig. 12 (left), the impaction probability distribution of a particle on the blue
trajectory is indicated as a function of the radial position on the persuing blade.
Vertical and horizontal velocity components have been varied in steps of 0.1 m s
−1
ranging from the mean velocity minus one standard deviation until the mean velocity
plus one standard deviation. The impaction probability is given as density distribution