

9 Impact Comminution in Jet Mills
325
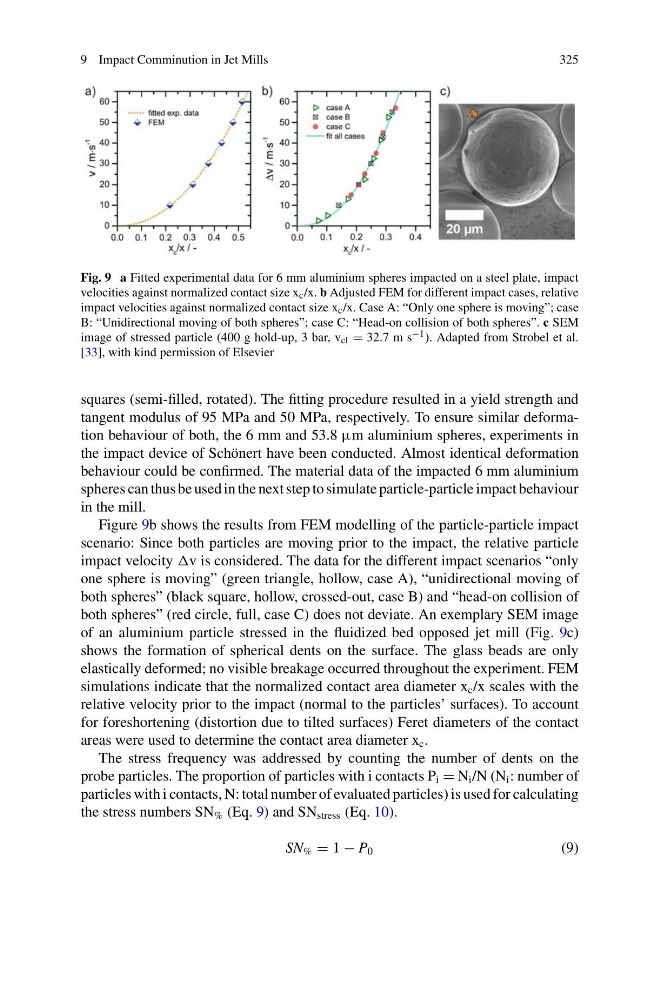
Fig. 9 a Fitted experimental data for 6 mm aluminium spheres impacted on a steel plate, impact
velocities against normalized contact size x c /x. b Adjusted FEM for different impact cases, relative
impact velocities against normalized contact size x c /x. Case A: “Only one sphere is moving”; case
B: “Unidirectional moving of both spheres”; case C: “Head-on collision of both spheres”. c SEM
image of stressed particle (400 g hold-up, 3 bar, v cl = 32.7 m s −1 ). Adapted from Strobel et al.
[33], with kind permission of Elsevier
squares (semi-filled, rotated). The fitting procedure resulted in a yield strength and
tangent modulus of 95 MPa and 50 MPa, respectively. To ensure similar deformation behaviour of both, the 6 mm and 53.8 μm aluminium spheres, experiments in
the impact device of Schönert have been conducted. Almost identical deformation
behaviour could be confirmed. The material data of the impacted 6 mm aluminium
spheres can thus be used in the next step to simulate particle-particle impact behaviour
in the mill.
Figure 9b shows the results from FEM modelling of the particle-particle impact
scenario: Since both particles are moving prior to the impact, the relative particle
impact velocity v is considered. The data for the different impact scenarios “only
one sphere is moving” (green triangle, hollow, case A), “unidirectional moving of
both spheres” (black square, hollow, crossed-out, case B) and “head-on collision of
both spheres” (red circle, full, case C) does not deviate. An exemplary SEM image
of an aluminium particle stressed in the fluidized bed opposed jet mill (Fig. 9c)
shows the formation of spherical dents on the surface. The glass beads are only
elastically deformed; no visible breakage occurred throughout the experiment. FEM
simulations indicate that the normalized contact area diameter x c /x scales with the
relative velocity prior to the impact (normal to the particles’ surfaces). To account
for foreshortening (distortion due to tilted surfaces) Feret diameters of the contact
areas were used to determine the contact area diameter x c .
The stress frequency was addressed by counting the number of dents on the
probe particles. The proportion of particles with i contacts P i = N i /N (N i : number of
particles with i contacts, N: total number of evaluated particles) is used for calculating
the stress numbers SN % (Eq. 9) and SN stress (Eq. 10).
SN % = 1 − P 0
(9)
325
Fig. 9 a Fitted experimental data for 6 mm aluminium spheres impacted on a steel plate, impact
velocities against normalized contact size x c /x. b Adjusted FEM for different impact cases, relative
impact velocities against normalized contact size x c /x. Case A: “Only one sphere is moving”; case
B: “Unidirectional moving of both spheres”; case C: “Head-on collision of both spheres”. c SEM
image of stressed particle (400 g hold-up, 3 bar, v cl = 32.7 m s −1 ). Adapted from Strobel et al.
[33], with kind permission of Elsevier
squares (semi-filled, rotated). The fitting procedure resulted in a yield strength and
tangent modulus of 95 MPa and 50 MPa, respectively. To ensure similar deformation behaviour of both, the 6 mm and 53.8 μm aluminium spheres, experiments in
the impact device of Schönert have been conducted. Almost identical deformation
behaviour could be confirmed. The material data of the impacted 6 mm aluminium
spheres can thus be used in the next step to simulate particle-particle impact behaviour
in the mill.
Figure 9b shows the results from FEM modelling of the particle-particle impact
scenario: Since both particles are moving prior to the impact, the relative particle
impact velocity v is considered. The data for the different impact scenarios “only
one sphere is moving” (green triangle, hollow, case A), “unidirectional moving of
both spheres” (black square, hollow, crossed-out, case B) and “head-on collision of
both spheres” (red circle, full, case C) does not deviate. An exemplary SEM image
of an aluminium particle stressed in the fluidized bed opposed jet mill (Fig. 9c)
shows the formation of spherical dents on the surface. The glass beads are only
elastically deformed; no visible breakage occurred throughout the experiment. FEM
simulations indicate that the normalized contact area diameter x c /x scales with the
relative velocity prior to the impact (normal to the particles’ surfaces). To account
for foreshortening (distortion due to tilted surfaces) Feret diameters of the contact
areas were used to determine the contact area diameter x c .
The stress frequency was addressed by counting the number of dents on the
probe particles. The proportion of particles with i contacts P i = N i /N (N i : number of
particles with i contacts, N: total number of evaluated particles) is used for calculating
the stress numbers SN % (Eq. 9) and SN stress (Eq. 10).
SN % = 1 − P 0
(9)