

1 Process Modeling for Dynamic Disperse Particle Separation …
25
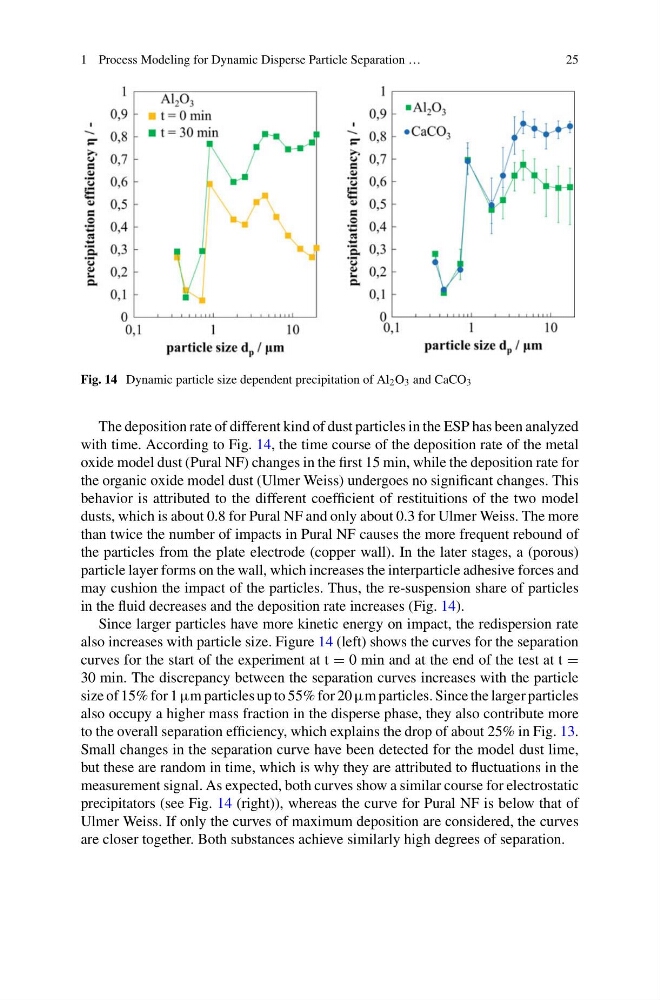
Fig. 14 Dynamic particle size dependent precipitation of Al 2 O 3 and CaCO 3
The deposition rate of different kind of dust particles in the ESP has been analyzed
with time. According to Fig. 14, the time course of the deposition rate of the metal
oxide model dust (Pural NF) changes in the first 15 min, while the deposition rate for
the organic oxide model dust (Ulmer Weiss) undergoes no significant changes. This
behavior is attributed to the different coefficient of restituitions of the two model
dusts, which is about 0.8 for Pural NF and only about 0.3 for Ulmer Weiss. The more
than twice the number of impacts in Pural NF causes the more frequent rebound of
the particles from the plate electrode (copper wall). In the later stages, a (porous)
particle layer forms on the wall, which increases the interparticle adhesive forces and
may cushion the impact of the particles. Thus, the re-suspension share of particles
in the fluid decreases and the deposition rate increases (Fig. 14).
Since larger particles have more kinetic energy on impact, the redispersion rate
also increases with particle size. Figure 14 (left) shows the curves for the separation
curves for the start of the experiment at t = 0 min and at the end of the test at t =
30 min. The discrepancy between the separation curves increases with the particle
size of 15% for 1 μm particles up to 55% for 20 μm particles. Since the larger particles
also occupy a higher mass fraction in the disperse phase, they also contribute more
to the overall separation efficiency, which explains the drop of about 25% in Fig. 13.
Small changes in the separation curve have been detected for the model dust lime,
but these are random in time, which is why they are attributed to fluctuations in the
measurement signal. As expected, both curves show a similar course for electrostatic
precipitators (see Fig. 14 (right)), whereas the curve for Pural NF is below that of
Ulmer Weiss. If only the curves of maximum deposition are considered, the curves
are closer together. Both substances achieve similarly high degrees of separation.
25
Fig. 14 Dynamic particle size dependent precipitation of Al 2 O 3 and CaCO 3
The deposition rate of different kind of dust particles in the ESP has been analyzed
with time. According to Fig. 14, the time course of the deposition rate of the metal
oxide model dust (Pural NF) changes in the first 15 min, while the deposition rate for
the organic oxide model dust (Ulmer Weiss) undergoes no significant changes. This
behavior is attributed to the different coefficient of restituitions of the two model
dusts, which is about 0.8 for Pural NF and only about 0.3 for Ulmer Weiss. The more
than twice the number of impacts in Pural NF causes the more frequent rebound of
the particles from the plate electrode (copper wall). In the later stages, a (porous)
particle layer forms on the wall, which increases the interparticle adhesive forces and
may cushion the impact of the particles. Thus, the re-suspension share of particles
in the fluid decreases and the deposition rate increases (Fig. 14).
Since larger particles have more kinetic energy on impact, the redispersion rate
also increases with particle size. Figure 14 (left) shows the curves for the separation
curves for the start of the experiment at t = 0 min and at the end of the test at t =
30 min. The discrepancy between the separation curves increases with the particle
size of 15% for 1 μm particles up to 55% for 20 μm particles. Since the larger particles
also occupy a higher mass fraction in the disperse phase, they also contribute more
to the overall separation efficiency, which explains the drop of about 25% in Fig. 13.
Small changes in the separation curve have been detected for the model dust lime,
but these are random in time, which is why they are attributed to fluctuations in the
measurement signal. As expected, both curves show a similar course for electrostatic
precipitators (see Fig. 14 (right)), whereas the curve for Pural NF is below that of
Ulmer Weiss. If only the curves of maximum deposition are considered, the curves
are closer together. Both substances achieve similarly high degrees of separation.