

8 Flowsheet Simulation of Integrated Precipitation Processes
287
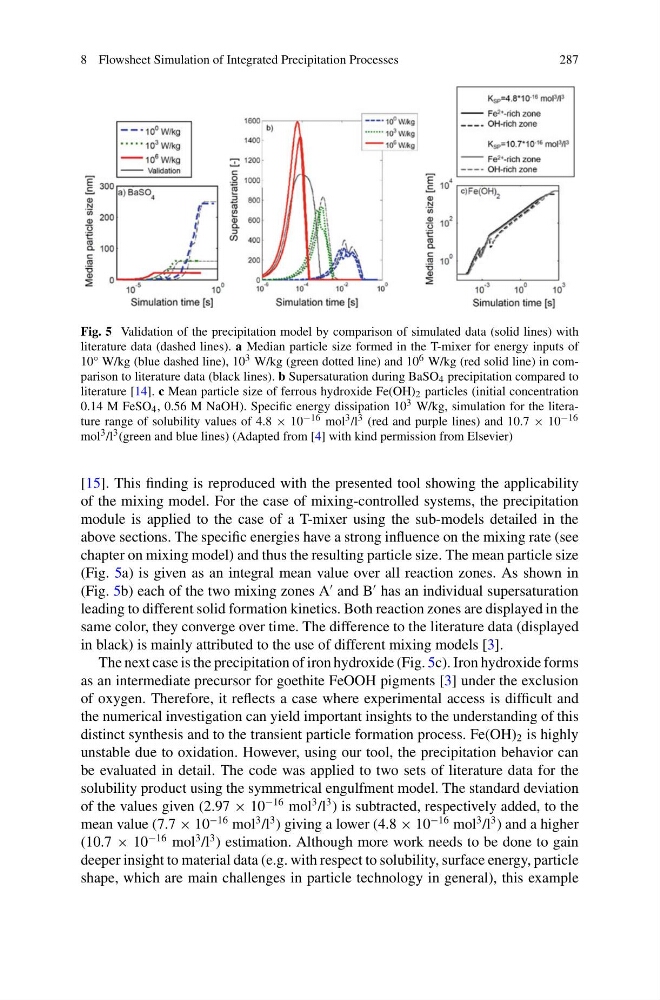
Fig. 5 Validation of the precipitation model by comparison of simulated data (solid lines) with
literature data (dashed lines). a Median particle size formed in the T-mixer for energy inputs of
10° W/kg (blue dashed line), 10 3 W/kg (green dotted line) and 10 6 W/kg (red solid line) in comparison to literature data (black lines). b Supersaturation during BaSO 4 precipitation compared to
literature [14]. c Mean particle size of ferrous hydroxide Fe(OH) 2 particles (initial concentration
0.14 M FeSO 4 , 0.56 M NaOH). Specific energy dissipation 10 3 W/kg, simulation for the literature range of solubility values of 4.8 × 10 −16 mol 3 /l 3 (red and purple lines) and 10.7 × 10 −16
mol 3 /l 3 (green and blue lines) (Adapted from [4] with kind permission from Elsevier)
[15]. This finding is reproduced with the presented tool showing the applicability
of the mixing model. For the case of mixing-controlled systems, the precipitation
module is applied to the case of a T-mixer using the sub-models detailed in the
above sections. The specific energies have a strong influence on the mixing rate (see
chapter on mixing model) and thus the resulting particle size. The mean particle size
(Fig. 5a) is given as an integral mean value over all reaction zones. As shown in
(Fig. 5b) each of the two mixing zones A
and B
has an individual supersaturation
leading to different solid formation kinetics. Both reaction zones are displayed in the
same color, they converge over time. The difference to the literature data (displayed
in black) is mainly attributed to the use of different mixing models [3].
The next case is the precipitation of iron hydroxide (Fig. 5c). Iron hydroxide forms
as an intermediate precursor for goethite FeOOH pigments [3] under the exclusion
of oxygen. Therefore, it reflects a case where experimental access is difficult and
the numerical investigation can yield important insights to the understanding of this
distinct synthesis and to the transient particle formation process. Fe(OH) 2 is highly
unstable due to oxidation. However, using our tool, the precipitation behavior can
be evaluated in detail. The code was applied to two sets of literature data for the
solubility product using the symmetrical engulfment model. The standard deviation
of the values given (2.97 × 10
−16 mol
3 /l
3 ) is subtracted, respectively added, to the
mean value (7.7 × 10
−16 mol
3 /l
3 ) giving a lower (4.8 × 10
−16 mol
3 /l
3 ) and a higher
(10.7 × 10
−16 mol
3 /l
3 ) estimation. Although more work needs to be done to gain
deeper insight to material data (e.g. with respect to solubility, surface energy, particle
shape, which are main challenges in particle technology in general), this example
287
Fig. 5 Validation of the precipitation model by comparison of simulated data (solid lines) with
literature data (dashed lines). a Median particle size formed in the T-mixer for energy inputs of
10° W/kg (blue dashed line), 10 3 W/kg (green dotted line) and 10 6 W/kg (red solid line) in comparison to literature data (black lines). b Supersaturation during BaSO 4 precipitation compared to
literature [14]. c Mean particle size of ferrous hydroxide Fe(OH) 2 particles (initial concentration
0.14 M FeSO 4 , 0.56 M NaOH). Specific energy dissipation 10 3 W/kg, simulation for the literature range of solubility values of 4.8 × 10 −16 mol 3 /l 3 (red and purple lines) and 10.7 × 10 −16
mol 3 /l 3 (green and blue lines) (Adapted from [4] with kind permission from Elsevier)
[15]. This finding is reproduced with the presented tool showing the applicability
of the mixing model. For the case of mixing-controlled systems, the precipitation
module is applied to the case of a T-mixer using the sub-models detailed in the
above sections. The specific energies have a strong influence on the mixing rate (see
chapter on mixing model) and thus the resulting particle size. The mean particle size
(Fig. 5a) is given as an integral mean value over all reaction zones. As shown in
(Fig. 5b) each of the two mixing zones A
and B
has an individual supersaturation
leading to different solid formation kinetics. Both reaction zones are displayed in the
same color, they converge over time. The difference to the literature data (displayed
in black) is mainly attributed to the use of different mixing models [3].
The next case is the precipitation of iron hydroxide (Fig. 5c). Iron hydroxide forms
as an intermediate precursor for goethite FeOOH pigments [3] under the exclusion
of oxygen. Therefore, it reflects a case where experimental access is difficult and
the numerical investigation can yield important insights to the understanding of this
distinct synthesis and to the transient particle formation process. Fe(OH) 2 is highly
unstable due to oxidation. However, using our tool, the precipitation behavior can
be evaluated in detail. The code was applied to two sets of literature data for the
solubility product using the symmetrical engulfment model. The standard deviation
of the values given (2.97 × 10
−16 mol
3 /l
3 ) is subtracted, respectively added, to the
mean value (7.7 × 10
−16 mol
3 /l
3 ) giving a lower (4.8 × 10
−16 mol
3 /l
3 ) and a higher
(10.7 × 10
−16 mol
3 /l
3 ) estimation. Although more work needs to be done to gain
deeper insight to material data (e.g. with respect to solubility, surface energy, particle
shape, which are main challenges in particle technology in general), this example