

1 Process Modeling for Dynamic Disperse Particle Separation …
19
of oxygen in the fly ash allows conclusions to be drawn that the elements are oxidized. The complex mixture produces a fly-ash-specific electrical resistance, which
is difficult to deduce from the input variables in flowchart simulations but does affect
precipitation. The same applies to the carbon content of fly ash (Fig. 10).
In addition to the dependency of deposition from composition, the deposition of
fly ash depends on the particle size distribution in the input stream. The measurement of the non-agglomerated particles has been done by means of laser diffraction
spectroscopy (LDS) with a wet-dispersed sample. The LDS (Malvern Mastersizer)
determines the size distribution based on the light diffraction of a laser beam assuming
a universal multi-modal distribution.
The fly ash consists of about 10 wt% of sub-micron particles. Below 10 μm, 30%
of the mass of the particulate material is present (see Fig. 11, left). The remainder
of the material consists of particles with a maximum diameter of just over 100 μm,
the frequency of which is decreasing to larger particles. The LDS measured particle size distribution was compared to the distribution measured by a Malvern G3
optical microscope evaluation. Due to the lower resolution limit of the microscope
no submicron components could be determined. The G3 particle size distribution
corresponds to that of the LDS only for the larger particle fractions.
The LDS is able to detect particles with a minimum diameter of about 20 nm.
Since the measured distribution with a minimum diameter of 100 nm is close to
this limit, the particle size distribution was also qualitatively supported by electron
microscope (ESEM) images (see Fig. 11, right). The images show the presence of
particles below 1 μm.
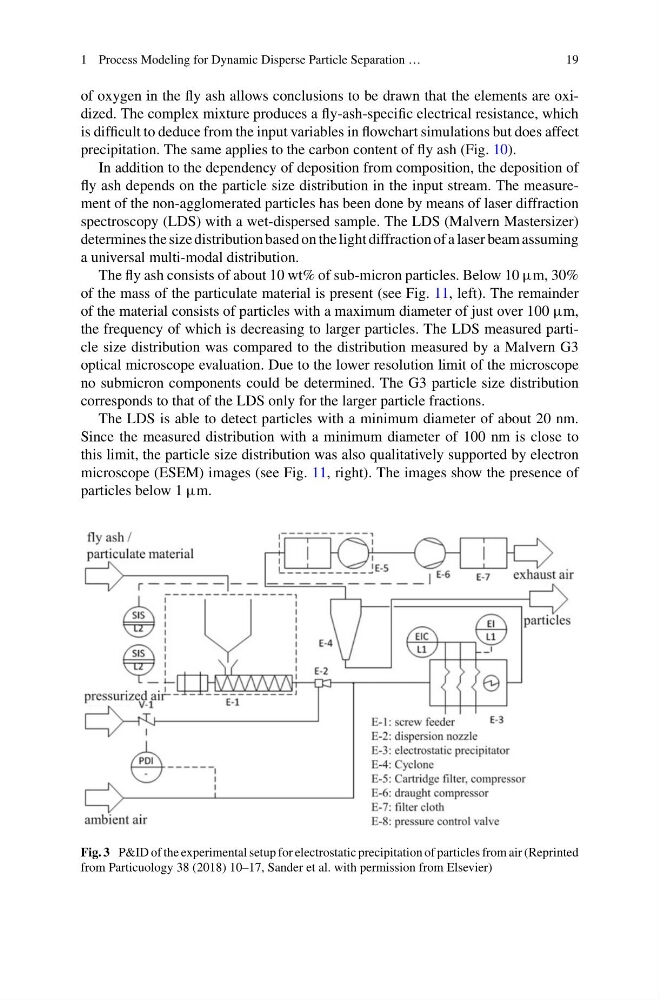
Fig. 3 P&ID of the experimental setup for electrostatic precipitation of particles from air (Reprinted
from Particuology 38 (2018) 10–17, Sander et al. with permission from Elsevier)
19
of oxygen in the fly ash allows conclusions to be drawn that the elements are oxidized. The complex mixture produces a fly-ash-specific electrical resistance, which
is difficult to deduce from the input variables in flowchart simulations but does affect
precipitation. The same applies to the carbon content of fly ash (Fig. 10).
In addition to the dependency of deposition from composition, the deposition of
fly ash depends on the particle size distribution in the input stream. The measurement of the non-agglomerated particles has been done by means of laser diffraction
spectroscopy (LDS) with a wet-dispersed sample. The LDS (Malvern Mastersizer)
determines the size distribution based on the light diffraction of a laser beam assuming
a universal multi-modal distribution.
The fly ash consists of about 10 wt% of sub-micron particles. Below 10 μm, 30%
of the mass of the particulate material is present (see Fig. 11, left). The remainder
of the material consists of particles with a maximum diameter of just over 100 μm,
the frequency of which is decreasing to larger particles. The LDS measured particle size distribution was compared to the distribution measured by a Malvern G3
optical microscope evaluation. Due to the lower resolution limit of the microscope
no submicron components could be determined. The G3 particle size distribution
corresponds to that of the LDS only for the larger particle fractions.
The LDS is able to detect particles with a minimum diameter of about 20 nm.
Since the measured distribution with a minimum diameter of 100 nm is close to
this limit, the particle size distribution was also qualitatively supported by electron
microscope (ESEM) images (see Fig. 11, right). The images show the presence of
particles below 1 μm.
Fig. 3 P&ID of the experimental setup for electrostatic precipitation of particles from air (Reprinted
from Particuology 38 (2018) 10–17, Sander et al. with permission from Elsevier)