

5 Development of a Dynamic-Physical Process Model for Sieving
187
Table 8 DEM parameters for POM and glass spheres and various contact partners. Reprint with
permission from [29]
Contact partner 1 Contact partner 2
μ c [−] μ roll [m]
e n
dr y [−]
POM sphere
Steel (side walls, screen wires,
bottom, outlet walls)
0.3484 5.97E−05
0.8473
POM sphere
POM sphere
0.3725 4.63E−05
0.8038
Glass sphere
Steel (side walls, screen wires,
bottom, outlet walls)
0.2866 1.09E−04
0.4351
Glass sphere
Glass sphere
0.1966 8.95E−05
0.7808
4.3.2 Numerical and Experimental Results Obtained
In the following, fractions retained Y obtained by experiments and by DEM simulations are presented and compared against each other. In Figs. 20 and 22, the results
are presented as fraction retained over time Y = Y (t) = m p,l /m p,l,0 , where m p,l,0
is the initial mass at t = 0 s and m p,l is the remaining mass of the particles together
with the liquid which is not in the collecting bin at time t.
In the first investigations, dry material with different sizes of the particles is
screened and the experimental results for the fraction retained on the screen over
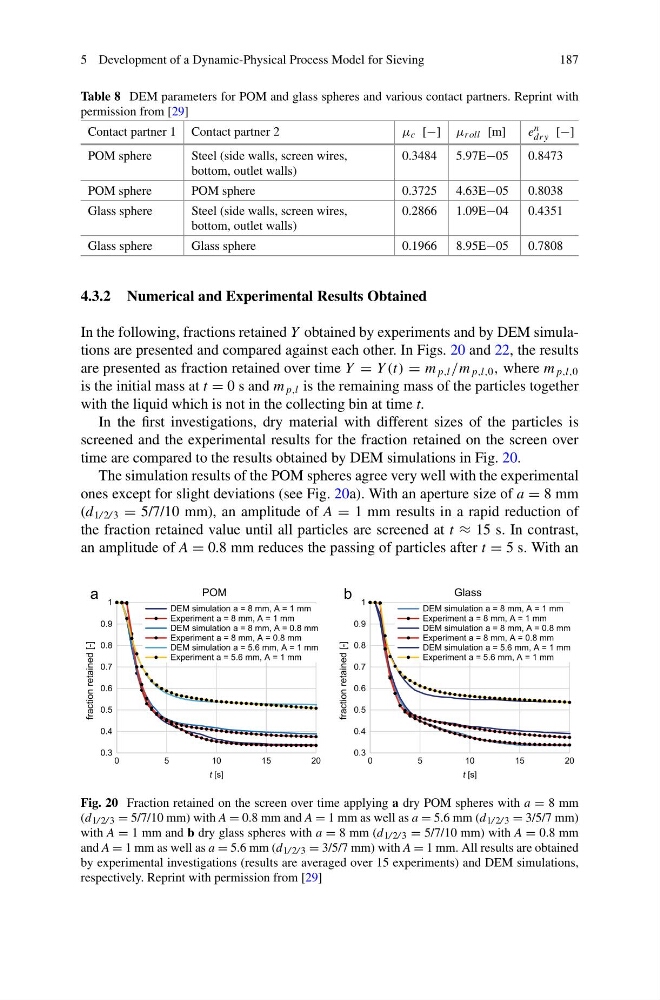
time are compared to the results obtained by DEM simulations in Fig. 20.
The simulation results of the POM spheres agree very well with the experimental
ones except for slight deviations (see Fig. 20a). With an aperture size of a = 8 mm
(d 1/ 2/ 3 = 5/7/10 mm), an amplitude of A = 1 mm results in a rapid reduction of
the fraction retained value until all particles are screened at t ≈ 15 s. In contrast,
an amplitude of A = 0.8 mm reduces the passing of particles after t = 5 s. With an
a
POM
b
Glass
0.3
0.4
0.5
0.6
0.7
0.8
0.9
1
0
5
10
15
20
fraction retained [-]
t [s]
DEM simulation a = 8 mm, A = 1 mm
Experiment a = 8 mm, A = 1 mm
DEM simulation a = 8 mm, A = 0.8 mm
Experiment a = 8 mm, A = 0.8 mm
DEM simulation a = 5.6 mm, A = 1 mm
Experiment a = 5.6 mm, A = 1 mm
0.3
0.4
0.5
0.6
0.7
0.8
0.9
1
0
5
10
15
20
fraction retained [-]
t [s]
DEM simulation a = 8 mm, A = 1 mm
Experiment a = 8 mm, A = 1 mm
DEM simulation a = 8 mm, A = 0.8 mm
Experiment a = 8 mm, A = 0.8 mm
DEM simulation a = 5.6 mm, A = 1 mm
Experiment a = 5.6 mm, A = 1 mm
Fig. 20 Fraction retained on the screen over time applying a dry POM spheres with a = 8 mm
(d 1/ 2/ 3 = 5/7/10 mm) with A = 0.8 mm and A = 1 mm as well as a = 5.6 mm (d 1/ 2/ 3 = 3/5/7 mm)
with A = 1 mm and b dry glass spheres with a = 8 mm (d 1/ 2/ 3 = 5/7/10 mm) with A = 0.8 mm
and A = 1 mm as well as a = 5.6 mm (d 1/ 2/ 3 = 3/5/7 mm) with A = 1 mm. All results are obtained
by experimental investigations (results are averaged over 15 experiments) and DEM simulations,
respectively. Reprint with permission from [29]
187
Table 8 DEM parameters for POM and glass spheres and various contact partners. Reprint with
permission from [29]
Contact partner 1 Contact partner 2
μ c [−] μ roll [m]
e n
dr y [−]
POM sphere
Steel (side walls, screen wires,
bottom, outlet walls)
0.3484 5.97E−05
0.8473
POM sphere
POM sphere
0.3725 4.63E−05
0.8038
Glass sphere
Steel (side walls, screen wires,
bottom, outlet walls)
0.2866 1.09E−04
0.4351
Glass sphere
Glass sphere
0.1966 8.95E−05
0.7808
4.3.2 Numerical and Experimental Results Obtained
In the following, fractions retained Y obtained by experiments and by DEM simulations are presented and compared against each other. In Figs. 20 and 22, the results
are presented as fraction retained over time Y = Y (t) = m p,l /m p,l,0 , where m p,l,0
is the initial mass at t = 0 s and m p,l is the remaining mass of the particles together
with the liquid which is not in the collecting bin at time t.
In the first investigations, dry material with different sizes of the particles is
screened and the experimental results for the fraction retained on the screen over
time are compared to the results obtained by DEM simulations in Fig. 20.
The simulation results of the POM spheres agree very well with the experimental
ones except for slight deviations (see Fig. 20a). With an aperture size of a = 8 mm
(d 1/ 2/ 3 = 5/7/10 mm), an amplitude of A = 1 mm results in a rapid reduction of
the fraction retained value until all particles are screened at t ≈ 15 s. In contrast,
an amplitude of A = 0.8 mm reduces the passing of particles after t = 5 s. With an
a
POM
b
Glass
0.3
0.4
0.5
0.6
0.7
0.8
0.9
1
0
5
10
15
20
fraction retained [-]
t [s]
DEM simulation a = 8 mm, A = 1 mm
Experiment a = 8 mm, A = 1 mm
DEM simulation a = 8 mm, A = 0.8 mm
Experiment a = 8 mm, A = 0.8 mm
DEM simulation a = 5.6 mm, A = 1 mm
Experiment a = 5.6 mm, A = 1 mm
0.3
0.4
0.5
0.6
0.7
0.8
0.9
1
0
5
10
15
20
fraction retained [-]
t [s]
DEM simulation a = 8 mm, A = 1 mm
Experiment a = 8 mm, A = 1 mm
DEM simulation a = 8 mm, A = 0.8 mm
Experiment a = 8 mm, A = 0.8 mm
DEM simulation a = 5.6 mm, A = 1 mm
Experiment a = 5.6 mm, A = 1 mm
Fig. 20 Fraction retained on the screen over time applying a dry POM spheres with a = 8 mm
(d 1/ 2/ 3 = 5/7/10 mm) with A = 0.8 mm and A = 1 mm as well as a = 5.6 mm (d 1/ 2/ 3 = 3/5/7 mm)
with A = 1 mm and b dry glass spheres with a = 8 mm (d 1/ 2/ 3 = 5/7/10 mm) with A = 0.8 mm
and A = 1 mm as well as a = 5.6 mm (d 1/ 2/ 3 = 3/5/7 mm) with A = 1 mm. All results are obtained
by experimental investigations (results are averaged over 15 experiments) and DEM simulations,
respectively. Reprint with permission from [29]