

136
H. Rehage and M. Kind
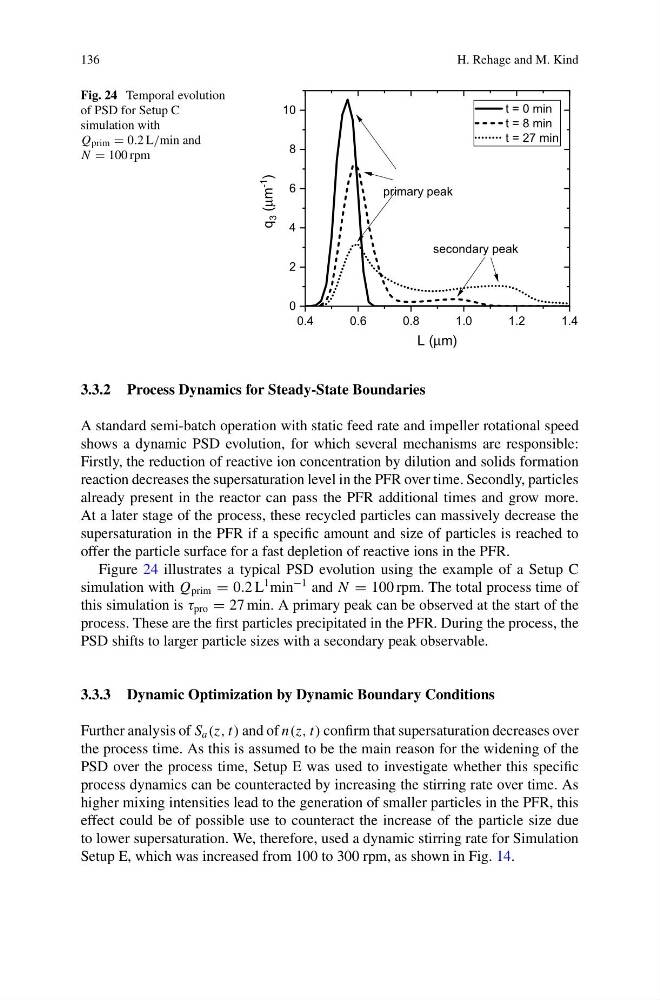
Fig. 24 Temporal evolution
of PSD for Setup C
simulation with
Q prim = 0.2 L/min and
N = 100 rpm
0.4
0.6
0.8
1.0
1.2
1.4
0
2
4
6
8
10
secondary peak
q
3 (μm
-1
)
L (μm)
t = 0 min
t = 8 min
t = 27 min
primary peak
3.3.2 Process Dynamics for Steady-State Boundaries
A standard semi-batch operation with static feed rate and impeller rotational speed
shows a dynamic PSD evolution, for which several mechanisms are responsible:
Firstly, the reduction of reactive ion concentration by dilution and solids formation
reaction decreases the supersaturation level in the PFR over time. Secondly, particles
already present in the reactor can pass the PFR additional times and grow more.
At a later stage of the process, these recycled particles can massively decrease the
supersaturation in the PFR if a specific amount and size of particles is reached to
offer the particle surface for a fast depletion of reactive ions in the PFR.
Figure 24 illustrates a typical PSD evolution using the example of a Setup C
simulation with Q prim = 0.2 L
1 min
−1 and N = 100 rpm. The total process time of
this simulation is τ pro = 27 min. A primary peak can be observed at the start of the
process. These are the first particles precipitated in the PFR. During the process, the
PSD shifts to larger particle sizes with a secondary peak observable.
3.3.3 Dynamic Optimization by Dynamic Boundary Conditions
Further analysis of S a (z, t) and of n(z, t) confirm that supersaturation decreases over
the process time. As this is assumed to be the main reason for the widening of the
PSD over the process time, Setup E was used to investigate whether this specific
process dynamics can be counteracted by increasing the stirring rate over time. As
higher mixing intensities lead to the generation of smaller particles in the PFR, this
effect could be of possible use to counteract the increase of the particle size due
to lower supersaturation. We, therefore, used a dynamic stirring rate for Simulation
Setup E, which was increased from 100 to 300 rpm, as shown in Fig. 14.
H. Rehage and M. Kind
Fig. 24 Temporal evolution
of PSD for Setup C
simulation with
Q prim = 0.2 L/min and
N = 100 rpm
0.4
0.6
0.8
1.0
1.2
1.4
0
2
4
6
8
10
secondary peak
q
3 (μm
-1
)
L (μm)
t = 0 min
t = 8 min
t = 27 min
primary peak
3.3.2 Process Dynamics for Steady-State Boundaries
A standard semi-batch operation with static feed rate and impeller rotational speed
shows a dynamic PSD evolution, for which several mechanisms are responsible:
Firstly, the reduction of reactive ion concentration by dilution and solids formation
reaction decreases the supersaturation level in the PFR over time. Secondly, particles
already present in the reactor can pass the PFR additional times and grow more.
At a later stage of the process, these recycled particles can massively decrease the
supersaturation in the PFR if a specific amount and size of particles is reached to
offer the particle surface for a fast depletion of reactive ions in the PFR.
Figure 24 illustrates a typical PSD evolution using the example of a Setup C
simulation with Q prim = 0.2 L
1 min
−1 and N = 100 rpm. The total process time of
this simulation is τ pro = 27 min. A primary peak can be observed at the start of the
process. These are the first particles precipitated in the PFR. During the process, the
PSD shifts to larger particle sizes with a secondary peak observable.
3.3.3 Dynamic Optimization by Dynamic Boundary Conditions
Further analysis of S a (z, t) and of n(z, t) confirm that supersaturation decreases over
the process time. As this is assumed to be the main reason for the widening of the
PSD over the process time, Setup E was used to investigate whether this specific
process dynamics can be counteracted by increasing the stirring rate over time. As
higher mixing intensities lead to the generation of smaller particles in the PFR, this
effect could be of possible use to counteract the increase of the particle size due
to lower supersaturation. We, therefore, used a dynamic stirring rate for Simulation
Setup E, which was increased from 100 to 300 rpm, as shown in Fig. 14.