

4 Dynamic Simulation of Technical Precipitation Processes
131
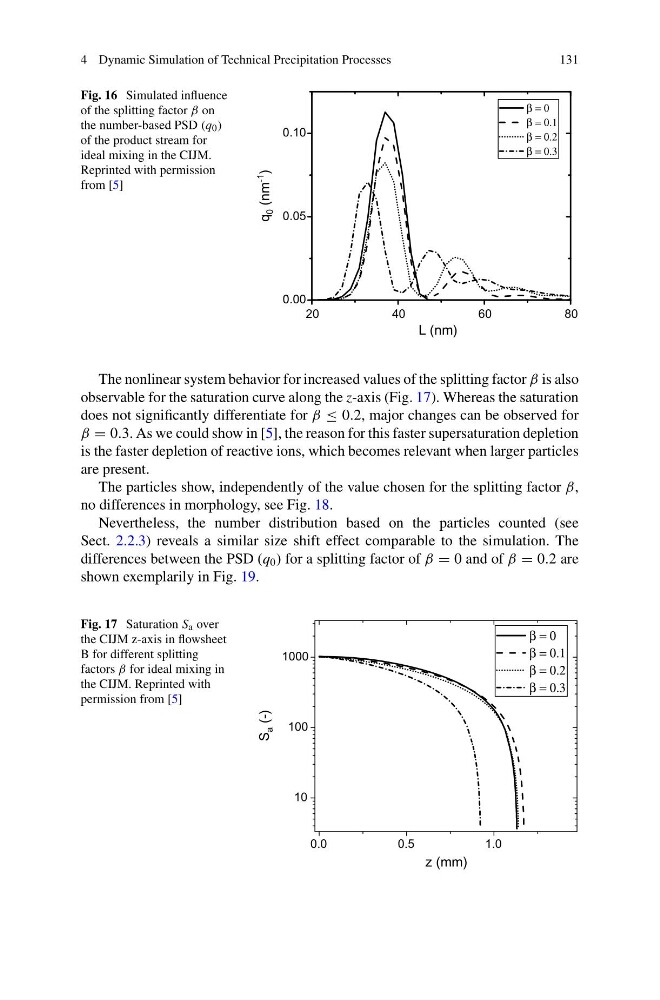
Fig. 16 Simulated influence
of the splitting factor β on
the number-based PSD (q 0 )
of the product stream for
ideal mixing in the CIJM.
Reprinted with permission
from [5]
20
40
60
80
0.00
0.05
0.10
q
0 (nm
-1
)
L (nm)
β = 0
β = 0.1
β = 0.2
β = 0.3
The nonlinear system behavior for increased values of the splitting factor β is also
observable for the saturation curve along the z-axis (Fig. 17). Whereas the saturation
does not significantly differentiate for β ≤ 0.2, major changes can be observed for
β = 0.3. As we could show in [5], the reason for this faster supersaturation depletion
is the faster depletion of reactive ions, which becomes relevant when larger particles
are present.
The particles show, independently of the value chosen for the splitting factor β,
no differences in morphology, see Fig. 18.
Nevertheless, the number distribution based on the particles counted (see
Sect. 2.2.3) reveals a similar size shift effect comparable to the simulation. The
differences between the PSD (q 0 ) for a splitting factor of β = 0 and of β = 0.2 are
shown exemplarily in Fig. 19.
Fig. 17 Saturation S a over
the CIJM z-axis in flowsheet
B for different splitting
factors β for ideal mixing in
the CIJM. Reprinted with
permission from [5]
0.0
0.5
1.0
10
100
1000
S
a (-)
z (mm)
β = 0
β = 0.1
β = 0.2
β = 0.3
131
Fig. 16 Simulated influence
of the splitting factor β on
the number-based PSD (q 0 )
of the product stream for
ideal mixing in the CIJM.
Reprinted with permission
from [5]
20
40
60
80
0.00
0.05
0.10
q
0 (nm
-1
)
L (nm)
β = 0
β = 0.1
β = 0.2
β = 0.3
The nonlinear system behavior for increased values of the splitting factor β is also
observable for the saturation curve along the z-axis (Fig. 17). Whereas the saturation
does not significantly differentiate for β ≤ 0.2, major changes can be observed for
β = 0.3. As we could show in [5], the reason for this faster supersaturation depletion
is the faster depletion of reactive ions, which becomes relevant when larger particles
are present.
The particles show, independently of the value chosen for the splitting factor β,
no differences in morphology, see Fig. 18.
Nevertheless, the number distribution based on the particles counted (see
Sect. 2.2.3) reveals a similar size shift effect comparable to the simulation. The
differences between the PSD (q 0 ) for a splitting factor of β = 0 and of β = 0.2 are
shown exemplarily in Fig. 19.
Fig. 17 Saturation S a over
the CIJM z-axis in flowsheet
B for different splitting
factors β for ideal mixing in
the CIJM. Reprinted with
permission from [5]
0.0
0.5
1.0
10
100
1000
S
a (-)
z (mm)
β = 0
β = 0.1
β = 0.2
β = 0.3