

4 Dynamic Simulation of Technical Precipitation Processes
129
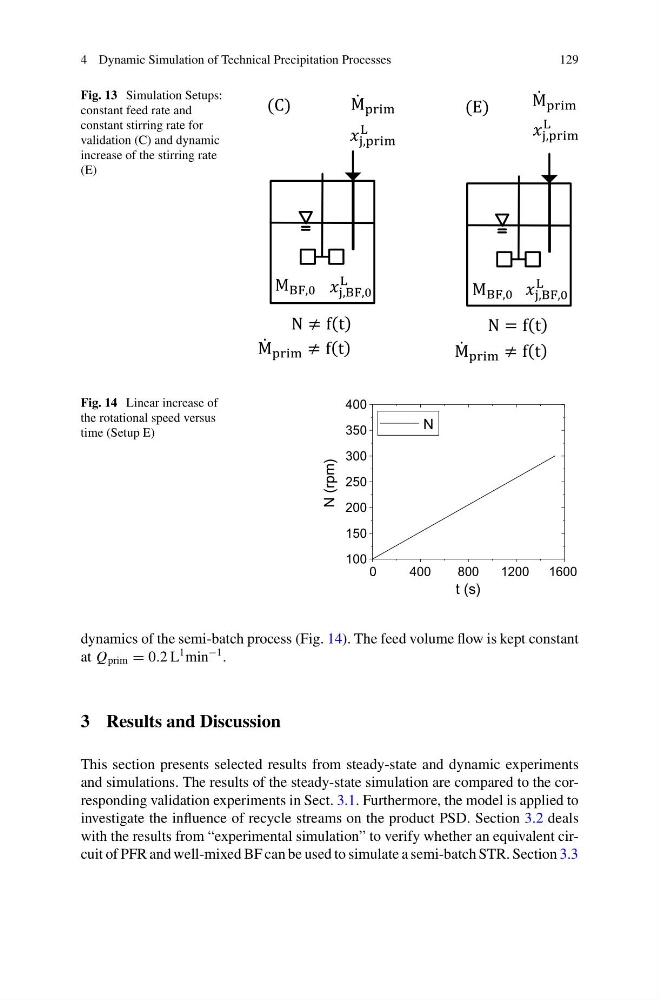
Fig. 13 Simulation Setups:
constant feed rate and
constant stirring rate for
validation (C) and dynamic
increase of the stirring rate
(E)
Fig. 14 Linear increase of
the rotational speed versus
time (Setup E)
0
400
800
1200
1600
100
150
200
250
300
350
400
N (rpm)
t (s)
N
dynamics of the semi-batch process (Fig. 14). The feed volume flow is kept constant
at Q prim = 0.2 L
1 min
−1 .
3 Results and Discussion
This section presents selected results from steady-state and dynamic experiments
and simulations. The results of the steady-state simulation are compared to the corresponding validation experiments in Sect. 3.1. Furthermore, the model is applied to
investigate the influence of recycle streams on the product PSD. Section 3.2 deals
with the results from “experimental simulation” to verify whether an equivalent circuit of PFR and well-mixed BF can be used to simulate a semi-batch STR. Section 3.3
129
Fig. 13 Simulation Setups:
constant feed rate and
constant stirring rate for
validation (C) and dynamic
increase of the stirring rate
(E)
Fig. 14 Linear increase of
the rotational speed versus
time (Setup E)
0
400
800
1200
1600
100
150
200
250
300
350
400
N (rpm)
t (s)
N
dynamics of the semi-batch process (Fig. 14). The feed volume flow is kept constant
at Q prim = 0.2 L
1 min
−1 .
3 Results and Discussion
This section presents selected results from steady-state and dynamic experiments
and simulations. The results of the steady-state simulation are compared to the corresponding validation experiments in Sect. 3.1. Furthermore, the model is applied to
investigate the influence of recycle streams on the product PSD. Section 3.2 deals
with the results from “experimental simulation” to verify whether an equivalent circuit of PFR and well-mixed BF can be used to simulate a semi-batch STR. Section 3.3