

(0.608), and NMe 2 (0.488). Bulky groups lower the BSO value effectively because
of the relatively small NiC bond length (1.9–2.0 Å). Noteworthy is that the CO and
CS ligand lead to BSO values of 0.811 and 1.062. They are comparable in their NiC
bond strength to that of substituted carbenes. Arduengo-type carbenes, which can
form a delocalized 6π-system, withdraw negative charge from Ni, thus increasing
the strength of the Ni–C bond. For five-membered rings with O atoms in α-position,
the withdrawal is stronger (BSO n ¼ 0.674 for CR5, Fig. 10) than for those with N
atoms (BSO n ¼ 0.599 for CR1, Fig. 10). It is interesting to note that the comparison
of k
a (CO) and k
a (NiC) values for Arduengo carbenes shown in Fig. 7 suggests a
reverse rather than inverse CO–NiC relationship for this group of ligands. This
explains the reported failures of describing MC bonding of Arduengo carbenes on
the basis of the TEP [139, 177, 218, 220, 300–303].
5.4 Ionic Ligands
As shown in Fig. 11, the methylidyne cation CH
+
, which has a σ-lone pair and two
empty pπ-orbitals for back donation has the strongest NiL bond (BSO n ¼ 2.373) of
all 181 [Ni(CO) 3 L] complexes investigated by Setiawan and co-workers [274].
In comparison, the methyl cation has a BSO n of just 0.720 and the t-butyl cation
an even smaller BSO n value of 0.409. In the first case, the lowering of the BSO
Carbenes
strongest
neutral ligand
1.229
:CH 2
:CF 2
:CMe 2
:CCl 2
:CMe(OMe)
:C(OMe) 2
C S
C O
:C=CF 2
:C(NH 2 ) 2
:C(NMe 2 ) 2
CR2
CR1
CR4
CR3
CR5
CR6
N
N
Me
Me
O
N
Me
S
N
Me
N
N
Me
Me
O
O
O
O
CR1
CR2
CR3
CR4
CR5
CR6
BSO(NiL)
0.4
0.6
0.8
1.0
1.2
k
a (NiL) [mdyn/Å]
1.0
1.5
2.0
2.5
0.60
0.65
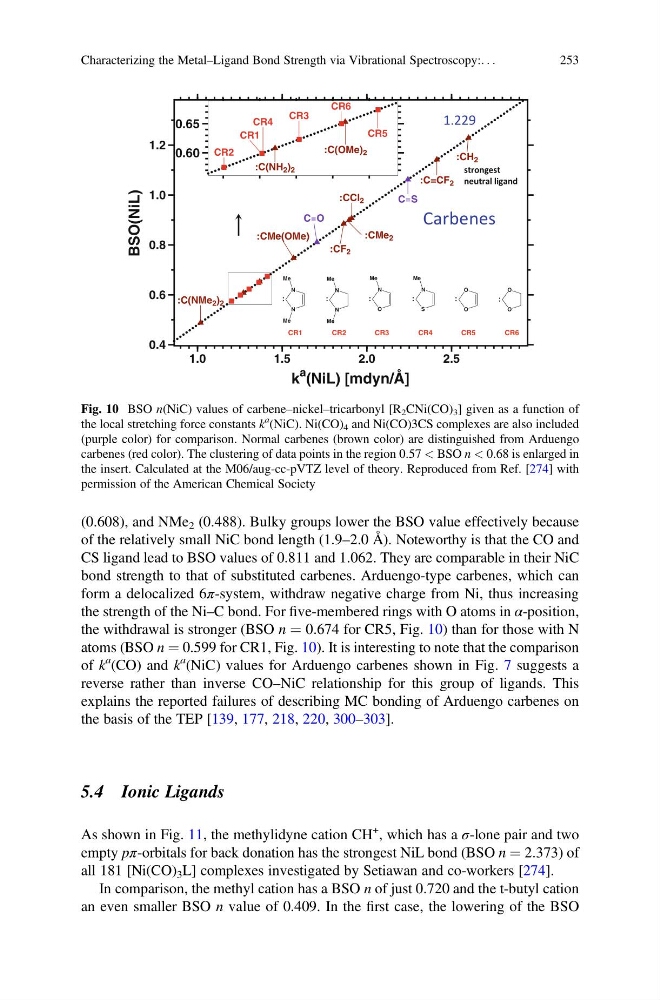
Fig. 10 BSO n(NiC) values of carbene–nickel–tricarbonyl [R 2 CNi(CO) 3 ] given as a function of
the local stretching force constants k
a (NiC). Ni(CO) 4 and Ni(CO)3CS complexes are also included
(purple color) for comparison. Normal carbenes (brown color) are distinguished from Arduengo
carbenes (red color). The clustering of data points in the region 0.57 < BSO n < 0.68 is enlarged in
the insert. Calculated at the M06/aug-cc-pVTZ level of theory. Reproduced from Ref. [274] with
permission of the American Chemical Society
Characterizing the Metal–Ligand Bond Strength via Vibrational Spectroscopy:. . .
253
of the relatively small NiC bond length (1.9–2.0 Å). Noteworthy is that the CO and
CS ligand lead to BSO values of 0.811 and 1.062. They are comparable in their NiC
bond strength to that of substituted carbenes. Arduengo-type carbenes, which can
form a delocalized 6π-system, withdraw negative charge from Ni, thus increasing
the strength of the Ni–C bond. For five-membered rings with O atoms in α-position,
the withdrawal is stronger (BSO n ¼ 0.674 for CR5, Fig. 10) than for those with N
atoms (BSO n ¼ 0.599 for CR1, Fig. 10). It is interesting to note that the comparison
of k
a (CO) and k
a (NiC) values for Arduengo carbenes shown in Fig. 7 suggests a
reverse rather than inverse CO–NiC relationship for this group of ligands. This
explains the reported failures of describing MC bonding of Arduengo carbenes on
the basis of the TEP [139, 177, 218, 220, 300–303].
5.4 Ionic Ligands
As shown in Fig. 11, the methylidyne cation CH
+
, which has a σ-lone pair and two
empty pπ-orbitals for back donation has the strongest NiL bond (BSO n ¼ 2.373) of
all 181 [Ni(CO) 3 L] complexes investigated by Setiawan and co-workers [274].
In comparison, the methyl cation has a BSO n of just 0.720 and the t-butyl cation
an even smaller BSO n value of 0.409. In the first case, the lowering of the BSO
Carbenes
strongest
neutral ligand
1.229
:CH 2
:CF 2
:CMe 2
:CCl 2
:CMe(OMe)
:C(OMe) 2
C S
C O
:C=CF 2
:C(NH 2 ) 2
:C(NMe 2 ) 2
CR2
CR1
CR4
CR3
CR5
CR6
N
N
Me
Me
O
N
Me
S
N
Me
N
N
Me
Me
O
O
O
O
CR1
CR2
CR3
CR4
CR5
CR6
BSO(NiL)
0.4
0.6
0.8
1.0
1.2
k
a (NiL) [mdyn/Å]
1.0
1.5
2.0
2.5
0.60
0.65
Fig. 10 BSO n(NiC) values of carbene–nickel–tricarbonyl [R 2 CNi(CO) 3 ] given as a function of
the local stretching force constants k
a (NiC). Ni(CO) 4 and Ni(CO)3CS complexes are also included
(purple color) for comparison. Normal carbenes (brown color) are distinguished from Arduengo
carbenes (red color). The clustering of data points in the region 0.57 < BSO n < 0.68 is enlarged in
the insert. Calculated at the M06/aug-cc-pVTZ level of theory. Reproduced from Ref. [274] with
permission of the American Chemical Society
Characterizing the Metal–Ligand Bond Strength via Vibrational Spectroscopy:. . .
253