

and into the two degenerate E normal modes ω 16 and ω 17 by switching on the masses
via the perturbation parameter λ. The three equivalent local mode frequencies
ω
a (5,6,7) (λ ¼ 0) have a value of 2,019 cm
À1 revealing a redshift of 225 cm
À1
compared to the stretching frequency of carbon monoxide calculated at the same
level of theory. Fully switching on the masses (endpoint: λ ¼ 1) leads to a mass
C O
H
H
C S
O H
H
CH 2
CH 2
O Me
Me
S H
H
S Me
Me
S
H
O
Me
S
Me
O
H
Si
Me
Me
Me
OH
B
OH
N
N
O
B
O
O
B
O
Me
Me
O
N
Me
S
N
Me
N
N
Me
Me
Si
H
H
H
O
O
O
O
O
Cl
O
F
O
Br
F
B
F
CH
CH
O F
F
O Cl
Cl
O Et
Et
O H
F
O H
Cl
N O
N C
N OH
N S
N Se
N H
H
N F
F
N
Cl
Cl
C H
C C H
C N
C
H
H
H
C
Me
Me
Me
C
H
H
H
C
Me
Me
Me
C
H
H
H
Si
Me
Me
Me
Si
H
H
H
Si H
P H
F
P
F
F
P
Cl
Cl
P
Br
Br
P
H
H
P
I
I
N N
N C H
N C Me
Cl
I
Br
F
H
At
N
B
N
Me
Me
N
B
N
Me
Me
O
B
N
Me
S
B
N
Me
Ni Y
C
C
C
O
O
O
Ni Y
C
C
C
O
O
O
Ni Y
C
C
C
O
O
O
R
R
R
R
R R
Ni Y
C
C
C
O
O
O
R
R
C
F
F
C
F
F
C
C
H
H
OMe
C
Me
NMe 2
C
NMe 2
NH 2
C
NH 2
C
Cl
Cl
C
OMe
OMe
C
Me
Me
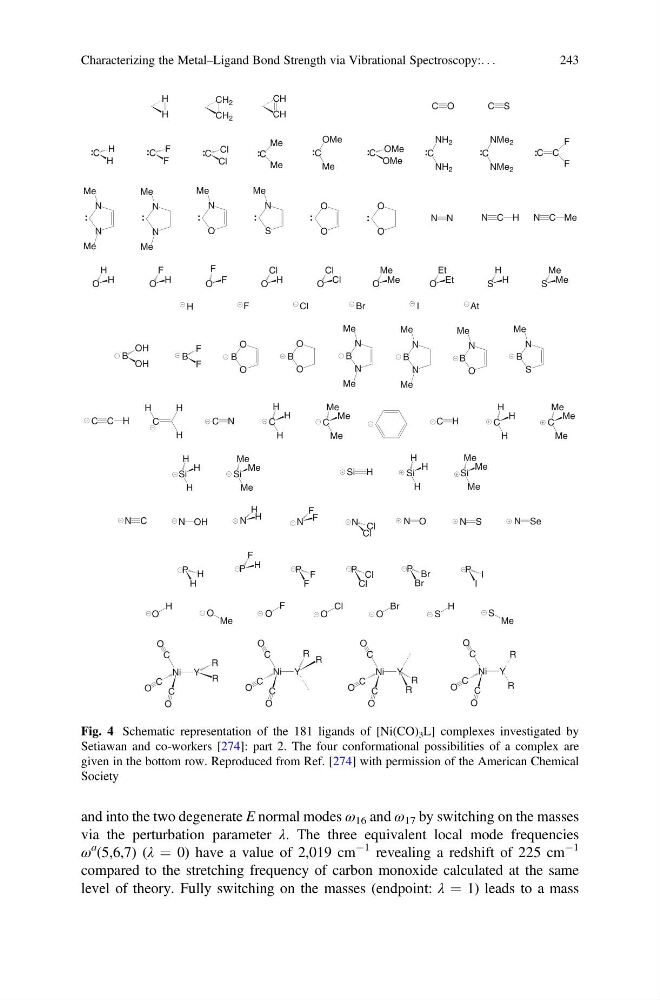
Fig. 4 Schematic representation of the 181 ligands of [Ni(CO) 3 L] complexes investigated by
Setiawan and co-workers [274]: part 2. The four conformational possibilities of a complex are
given in the bottom row. Reproduced from Ref. [274] with permission of the American Chemical
Society
Characterizing the Metal–Ligand Bond Strength via Vibrational Spectroscopy:. . .
243
via the perturbation parameter λ. The three equivalent local mode frequencies
ω
a (5,6,7) (λ ¼ 0) have a value of 2,019 cm
À1 revealing a redshift of 225 cm
À1
compared to the stretching frequency of carbon monoxide calculated at the same
level of theory. Fully switching on the masses (endpoint: λ ¼ 1) leads to a mass
C O
H
H
C S
O H
H
CH 2
CH 2
O Me
Me
S H
H
S Me
Me
S
H
O
Me
S
Me
O
H
Si
Me
Me
Me
OH
B
OH
N
N
O
B
O
O
B
O
Me
Me
O
N
Me
S
N
Me
N
N
Me
Me
Si
H
H
H
O
O
O
O
O
Cl
O
F
O
Br
F
B
F
CH
CH
O F
F
O Cl
Cl
O Et
Et
O H
F
O H
Cl
N O
N C
N OH
N S
N Se
N H
H
N F
F
N
Cl
Cl
C H
C C H
C N
C
H
H
H
C
Me
Me
Me
C
H
H
H
C
Me
Me
Me
C
H
H
H
Si
Me
Me
Me
Si
H
H
H
Si H
P H
F
P
F
F
P
Cl
Cl
P
Br
Br
P
H
H
P
I
I
N N
N C H
N C Me
Cl
I
Br
F
H
At
N
B
N
Me
Me
N
B
N
Me
Me
O
B
N
Me
S
B
N
Me
Ni Y
C
C
C
O
O
O
Ni Y
C
C
C
O
O
O
Ni Y
C
C
C
O
O
O
R
R
R
R
R R
Ni Y
C
C
C
O
O
O
R
R
C
F
F
C
F
F
C
C
H
H
OMe
C
Me
NMe 2
C
NMe 2
NH 2
C
NH 2
C
Cl
Cl
C
OMe
OMe
C
Me
Me
Fig. 4 Schematic representation of the 181 ligands of [Ni(CO) 3 L] complexes investigated by
Setiawan and co-workers [274]: part 2. The four conformational possibilities of a complex are
given in the bottom row. Reproduced from Ref. [274] with permission of the American Chemical
Society
Characterizing the Metal–Ligand Bond Strength via Vibrational Spectroscopy:. . .
243