

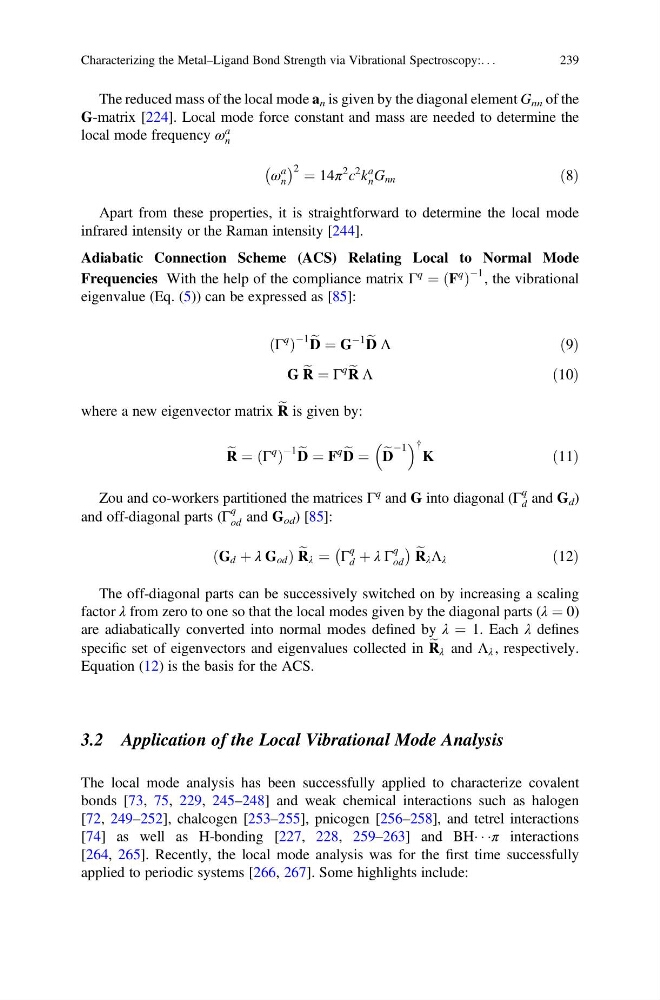
The reduced mass of the local mode a n is given by the diagonal element G nn of the
G-matrix [224]. Local mode force constant and mass are needed to determine the
local mode frequency ω
a
n
ω
a
n
À Á 2 ¼ 14π
2 c
2 k
a
n G nn
ð8Þ
Apart from these properties, it is straightforward to determine the local mode
infrared intensity or the Raman intensity [244].
Adiabatic Connection Scheme (ACS) Relating Local to Normal Mode
Frequencies With the help of the compliance matrix Γ
q
¼ F
q
ð Þ
À1 , the vibrational
eigenvalue (Eq. (5)) can be expressed as [85]:
Γ
q
ð Þ
À1 e
D ¼ G
À1 e
D Λ
ð9Þ
G e
R ¼ Γ
q e
R Λ
ð10Þ
where a new eigenvector matrix e
R is given by:
e
R ¼ Γ
q
ð Þ
À1 e
D ¼ F
q e
D ¼ e
D
À1
{
K
ð11Þ
Zou and co-workers partitioned the matrices Γ
q and G into diagonal (Γ
q
d and G d )
and off-diagonal parts (Γ
q
od and G od ) [85]:
G d þ λ G od
ð
Þ e
R λ ¼ Γ
q
d þ λ Γ
q
od
À
Á e
R λ Λ λ
ð12Þ
The off-diagonal parts can be successively switched on by increasing a scaling
factor λ from zero to one so that the local modes given by the diagonal parts (λ ¼ 0)
are adiabatically converted into normal modes defined by λ ¼ 1. Each λ defines
specific set of eigenvectors and eigenvalues collected in e
R λ and Λ λ , respectively.
Equation (12) is the basis for the ACS.
3.2 Application of the Local Vibrational Mode Analysis
The local mode analysis has been successfully applied to characterize covalent
bonds [73, 75, 229, 245–248] and weak chemical interactions such as halogen
[72, 249–252], chalcogen [253–255], pnicogen [256–258], and tetrel interactions
[74] as well as H-bonding [227, 228, 259–263] and BHÁ Á Áπ interactions
[264, 265]. Recently, the local mode analysis was for the first time successfully
applied to periodic systems [266, 267]. Some highlights include:
Characterizing the Metal–Ligand Bond Strength via Vibrational Spectroscopy:. . .
239
G-matrix [224]. Local mode force constant and mass are needed to determine the
local mode frequency ω
a
n
ω
a
n
À Á 2 ¼ 14π
2 c
2 k
a
n G nn
ð8Þ
Apart from these properties, it is straightforward to determine the local mode
infrared intensity or the Raman intensity [244].
Adiabatic Connection Scheme (ACS) Relating Local to Normal Mode
Frequencies With the help of the compliance matrix Γ
q
¼ F
q
ð Þ
À1 , the vibrational
eigenvalue (Eq. (5)) can be expressed as [85]:
Γ
q
ð Þ
À1 e
D ¼ G
À1 e
D Λ
ð9Þ
G e
R ¼ Γ
q e
R Λ
ð10Þ
where a new eigenvector matrix e
R is given by:
e
R ¼ Γ
q
ð Þ
À1 e
D ¼ F
q e
D ¼ e
D
À1
{
K
ð11Þ
Zou and co-workers partitioned the matrices Γ
q and G into diagonal (Γ
q
d and G d )
and off-diagonal parts (Γ
q
od and G od ) [85]:
G d þ λ G od
ð
Þ e
R λ ¼ Γ
q
d þ λ Γ
q
od
À
Á e
R λ Λ λ
ð12Þ
The off-diagonal parts can be successively switched on by increasing a scaling
factor λ from zero to one so that the local modes given by the diagonal parts (λ ¼ 0)
are adiabatically converted into normal modes defined by λ ¼ 1. Each λ defines
specific set of eigenvectors and eigenvalues collected in e
R λ and Λ λ , respectively.
Equation (12) is the basis for the ACS.
3.2 Application of the Local Vibrational Mode Analysis
The local mode analysis has been successfully applied to characterize covalent
bonds [73, 75, 229, 245–248] and weak chemical interactions such as halogen
[72, 249–252], chalcogen [253–255], pnicogen [256–258], and tetrel interactions
[74] as well as H-bonding [227, 228, 259–263] and BHÁ Á Áπ interactions
[264, 265]. Recently, the local mode analysis was for the first time successfully
applied to periodic systems [266, 267]. Some highlights include:
Characterizing the Metal–Ligand Bond Strength via Vibrational Spectroscopy:. . .
239