

harmonic approximation for molecules in the gas phase and to use them as a
computational electronic parameter (CEP) for the description of ML bonding
[138]. Most of the computational investigations suggested that CEPs obtained for
Ni, Ir, or Ru complexes correlate well with the experimental TEPs [139–144],
provided model chemistries are applied, which are suitable for the description of
metal complexes [139, 141, 145]. CEP values based on semiempirical calculations
were published for LMo(CO) 5 , LW(CO) 5 , and CpRh(CO)L complexes [146] or
rhodium Vaska-type complexes [147]. However, the results depend on the parametrization of the used semiempirical method. In addition to gas phase TEPs, CEPs
were also calculated for CO adsorbed by Ni–Au clusters [148]. Several review
articles have summarized the experimental and theoretical work in this field
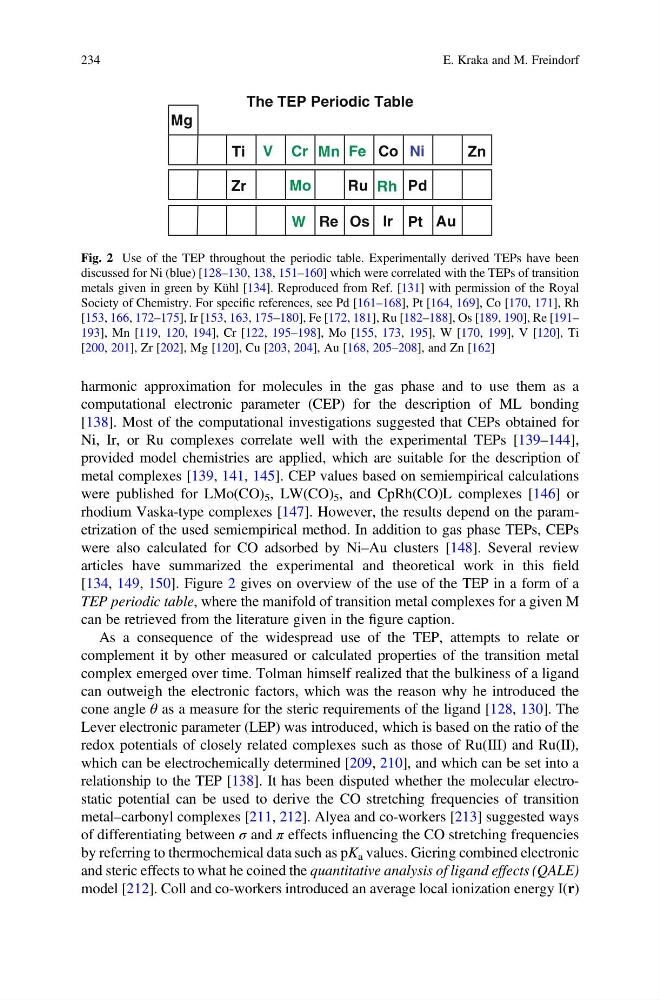
[134, 149, 150]. Figure 2 gives on overview of the use of the TEP in a form of a
TEP periodic table, where the manifold of transition metal complexes for a given M
can be retrieved from the literature given in the figure caption.
As a consequence of the widespread use of the TEP, attempts to relate or
complement it by other measured or calculated properties of the transition metal
complex emerged over time. Tolman himself realized that the bulkiness of a ligand
can outweigh the electronic factors, which was the reason why he introduced the
cone angle θ as a measure for the steric requirements of the ligand [128, 130]. The
Lever electronic parameter (LEP) was introduced, which is based on the ratio of the
redox potentials of closely related complexes such as those of Ru(III) and Ru(II),
which can be electrochemically determined [209, 210], and which can be set into a
relationship to the TEP [138]. It has been disputed whether the molecular electrostatic potential can be used to derive the CO stretching frequencies of transition
metal–carbonyl complexes [211, 212]. Alyea and co-workers [213] suggested ways
of differentiating between σ and π effects influencing the CO stretching frequencies
by referring to thermochemical data such as pK a values. Giering combined electronic
and steric effects to what he coined the quantitative analysis of ligand effects (QALE)
model [212]. Coll and co-workers introduced an average local ionization energy I(r)
Ni
Fe
Cr
V
Mo
W
Rh
Ir
Au
Mg
Zr
Pd
Re
Pt
Ru
Os
Ti
Co
Zn
Mn
The TEP Periodic Table
Fig. 2 Use of the TEP throughout the periodic table. Experimentally derived TEPs have been
discussed for Ni (blue) [128–130, 138, 151–160] which were correlated with the TEPs of transition
metals given in green by Kühl [134]. Reproduced from Ref. [131] with permission of the Royal
Society of Chemistry. For specific references, see Pd [161–168], Pt [164, 169], Co [170, 171], Rh
[153, 166, 172–175], Ir [153, 163, 175–180], Fe [172, 181], Ru [182–188], Os [189, 190], Re [191–
193], Mn [119, 120, 194], Cr [122, 195–198], Mo [155, 173, 195], W [170, 199], V [120], Ti
[200, 201], Zr [202], Mg [120], Cu [203, 204], Au [168, 205–208], and Zn [162]
234
E. Kraka and M. Freindorf
computational electronic parameter (CEP) for the description of ML bonding
[138]. Most of the computational investigations suggested that CEPs obtained for
Ni, Ir, or Ru complexes correlate well with the experimental TEPs [139–144],
provided model chemistries are applied, which are suitable for the description of
metal complexes [139, 141, 145]. CEP values based on semiempirical calculations
were published for LMo(CO) 5 , LW(CO) 5 , and CpRh(CO)L complexes [146] or
rhodium Vaska-type complexes [147]. However, the results depend on the parametrization of the used semiempirical method. In addition to gas phase TEPs, CEPs
were also calculated for CO adsorbed by Ni–Au clusters [148]. Several review
articles have summarized the experimental and theoretical work in this field
[134, 149, 150]. Figure 2 gives on overview of the use of the TEP in a form of a
TEP periodic table, where the manifold of transition metal complexes for a given M
can be retrieved from the literature given in the figure caption.
As a consequence of the widespread use of the TEP, attempts to relate or
complement it by other measured or calculated properties of the transition metal
complex emerged over time. Tolman himself realized that the bulkiness of a ligand
can outweigh the electronic factors, which was the reason why he introduced the
cone angle θ as a measure for the steric requirements of the ligand [128, 130]. The
Lever electronic parameter (LEP) was introduced, which is based on the ratio of the
redox potentials of closely related complexes such as those of Ru(III) and Ru(II),
which can be electrochemically determined [209, 210], and which can be set into a
relationship to the TEP [138]. It has been disputed whether the molecular electrostatic potential can be used to derive the CO stretching frequencies of transition
metal–carbonyl complexes [211, 212]. Alyea and co-workers [213] suggested ways
of differentiating between σ and π effects influencing the CO stretching frequencies
by referring to thermochemical data such as pK a values. Giering combined electronic
and steric effects to what he coined the quantitative analysis of ligand effects (QALE)
model [212]. Coll and co-workers introduced an average local ionization energy I(r)
Ni
Fe
Cr
V
Mo
W
Rh
Ir
Au
Mg
Zr
Pd
Re
Pt
Ru
Os
Ti
Co
Zn
Mn
The TEP Periodic Table
Fig. 2 Use of the TEP throughout the periodic table. Experimentally derived TEPs have been
discussed for Ni (blue) [128–130, 138, 151–160] which were correlated with the TEPs of transition
metals given in green by Kühl [134]. Reproduced from Ref. [131] with permission of the Royal
Society of Chemistry. For specific references, see Pd [161–168], Pt [164, 169], Co [170, 171], Rh
[153, 166, 172–175], Ir [153, 163, 175–180], Fe [172, 181], Ru [182–188], Os [189, 190], Re [191–
193], Mn [119, 120, 194], Cr [122, 195–198], Mo [155, 173, 195], W [170, 199], V [120], Ti
[200, 201], Zr [202], Mg [120], Cu [203, 204], Au [168, 205–208], and Zn [162]
234
E. Kraka and M. Freindorf