

70
3 Gas Hydrates
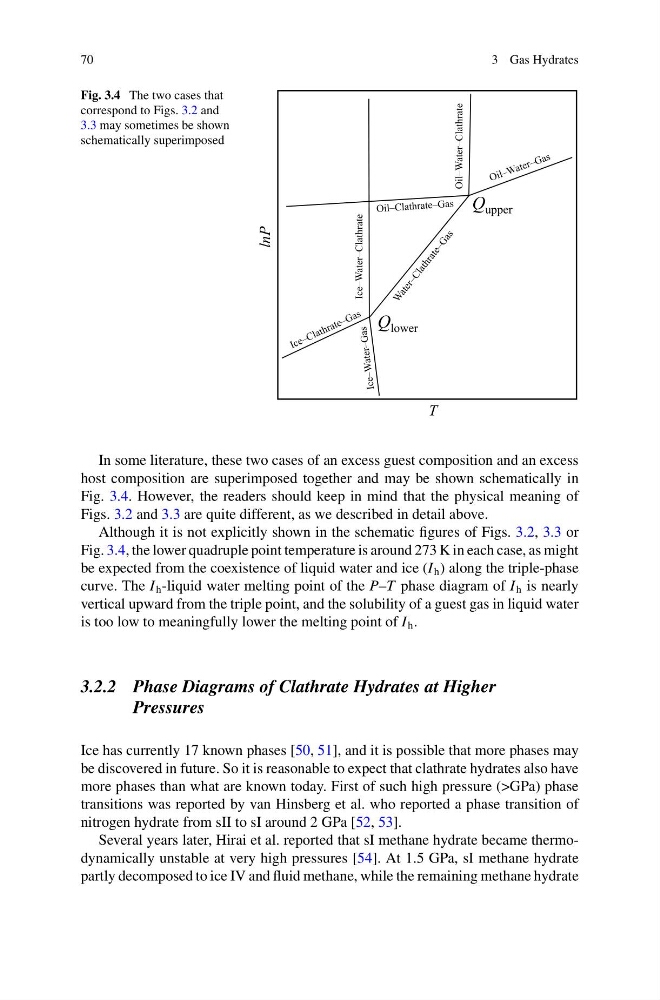
Fig. 3.4 The two cases that
correspond to Figs. 3.2 and
3.3 may sometimes be shown
schematically superimposed
Ice–Water–Clathrate
Oil–Water–Clathrate
T
lnP
Q lower
Q upper
In some literature, these two cases of an excess guest composition and an excess
host composition are superimposed together and may be shown schematically in
Fig. 3.4. However, the readers should keep in mind that the physical meaning of
Figs. 3.2 and 3.3 are quite different, as we described in detail above.
Although it is not explicitly shown in the schematic figures of Figs. 3.2, 3.3 or
Fig. 3.4, the lower quadruple point temperature is around 273 K in each case, as might
be expected from the coexistence of liquid water and ice (I h ) along the triple-phase
curve. The I h -liquid water melting point of the P–T phase diagram of I h is nearly
vertical upward from the triple point, and the solubility of a guest gas in liquid water
is too low to meaningfully lower the melting point of I h .
3.2.2 Phase Diagrams of Clathrate Hydrates at Higher
Pressures
Ice has currently 17 known phases [50, 51], and it is possible that more phases may
be discovered in future. So it is reasonable to expect that clathrate hydrates also have
more phases than what are known today. First of such high pressure (>GPa) phase
transitions was reported by van Hinsberg et al. who reported a phase transition of
nitrogen hydrate from sII to sI around 2 GPa [52, 53].
Several years later, Hirai et al. reported that sI methane hydrate became thermodynamically unstable at very high pressures [54]. At 1.5 GPa, sI methane hydrate
partly decomposed to ice IV and fluid methane, while the remaining methane hydrate
3 Gas Hydrates
Fig. 3.4 The two cases that
correspond to Figs. 3.2 and
3.3 may sometimes be shown
schematically superimposed
Ice–Water–Clathrate
Oil–Water–Clathrate
T
lnP
Q lower
Q upper
In some literature, these two cases of an excess guest composition and an excess
host composition are superimposed together and may be shown schematically in
Fig. 3.4. However, the readers should keep in mind that the physical meaning of
Figs. 3.2 and 3.3 are quite different, as we described in detail above.
Although it is not explicitly shown in the schematic figures of Figs. 3.2, 3.3 or
Fig. 3.4, the lower quadruple point temperature is around 273 K in each case, as might
be expected from the coexistence of liquid water and ice (I h ) along the triple-phase
curve. The I h -liquid water melting point of the P–T phase diagram of I h is nearly
vertical upward from the triple point, and the solubility of a guest gas in liquid water
is too low to meaningfully lower the melting point of I h .
3.2.2 Phase Diagrams of Clathrate Hydrates at Higher
Pressures
Ice has currently 17 known phases [50, 51], and it is possible that more phases may
be discovered in future. So it is reasonable to expect that clathrate hydrates also have
more phases than what are known today. First of such high pressure (>GPa) phase
transitions was reported by van Hinsberg et al. who reported a phase transition of
nitrogen hydrate from sII to sI around 2 GPa [52, 53].
Several years later, Hirai et al. reported that sI methane hydrate became thermodynamically unstable at very high pressures [54]. At 1.5 GPa, sI methane hydrate
partly decomposed to ice IV and fluid methane, while the remaining methane hydrate