

2.1 Constant Temperature Method
39
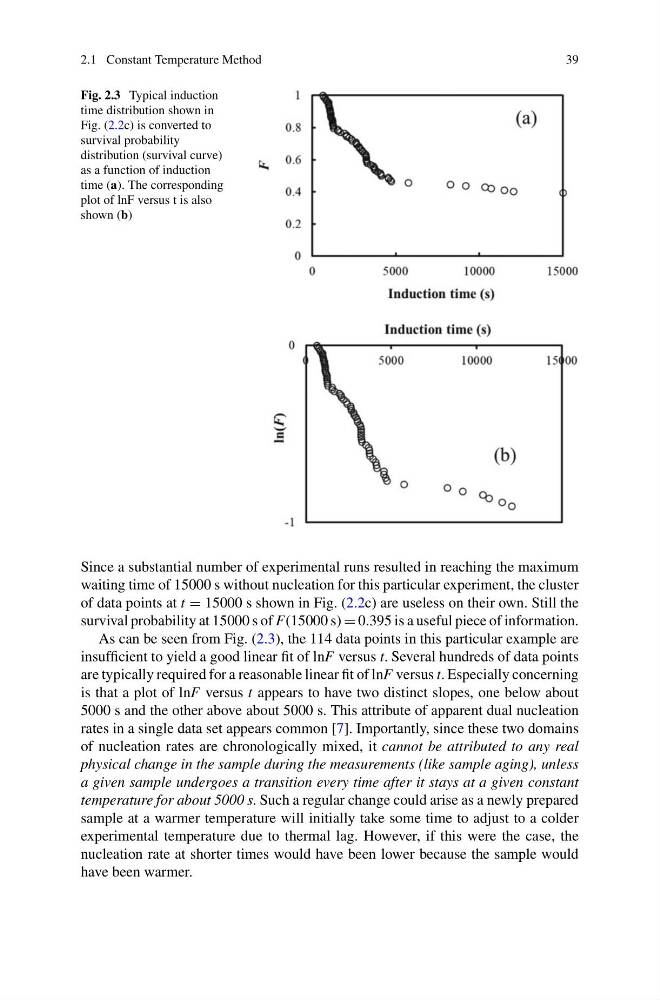
Fig. 2.3 Typical induction
time distribution shown in
Fig. (2.2c) is converted to
survival probability
distribution (survival curve)
as a function of induction
time (a). The corresponding
plot of lnF versus t is also
shown (b)
Since a substantial number of experimental runs resulted in reaching the maximum
waiting time of 15000 s without nucleation for this particular experiment, the cluster
of data points at t = 15000 s shown in Fig. (2.2c) are useless on their own. Still the
survival probability at 15000 s of F(15000 s) = 0.395 is a useful piece of information.
As can be seen from Fig. (2.3), the 114 data points in this particular example are
insufficient to yield a good linear fit of lnF versus t. Several hundreds of data points
are typically required for a reasonable linear fit of lnF versus t. Especially concerning
is that a plot of lnF versus t appears to have two distinct slopes, one below about
5000 s and the other above about 5000 s. This attribute of apparent dual nucleation
rates in a single data set appears common [7]. Importantly, since these two domains
of nucleation rates are chronologically mixed, it cannot be attributed to any real
physical change in the sample during the measurements (like sample aging), unless
a given sample undergoes a transition every time after it stays at a given constant
temperature for about 5000 s. Such a regular change could arise as a newly prepared
sample at a warmer temperature will initially take some time to adjust to a colder
experimental temperature due to thermal lag. However, if this were the case, the
nucleation rate at shorter times would have been lower because the sample would
have been warmer.
39
Fig. 2.3 Typical induction
time distribution shown in
Fig. (2.2c) is converted to
survival probability
distribution (survival curve)
as a function of induction
time (a). The corresponding
plot of lnF versus t is also
shown (b)
Since a substantial number of experimental runs resulted in reaching the maximum
waiting time of 15000 s without nucleation for this particular experiment, the cluster
of data points at t = 15000 s shown in Fig. (2.2c) are useless on their own. Still the
survival probability at 15000 s of F(15000 s) = 0.395 is a useful piece of information.
As can be seen from Fig. (2.3), the 114 data points in this particular example are
insufficient to yield a good linear fit of lnF versus t. Several hundreds of data points
are typically required for a reasonable linear fit of lnF versus t. Especially concerning
is that a plot of lnF versus t appears to have two distinct slopes, one below about
5000 s and the other above about 5000 s. This attribute of apparent dual nucleation
rates in a single data set appears common [7]. Importantly, since these two domains
of nucleation rates are chronologically mixed, it cannot be attributed to any real
physical change in the sample during the measurements (like sample aging), unless
a given sample undergoes a transition every time after it stays at a given constant
temperature for about 5000 s. Such a regular change could arise as a newly prepared
sample at a warmer temperature will initially take some time to adjust to a colder
experimental temperature due to thermal lag. However, if this were the case, the
nucleation rate at shorter times would have been lower because the sample would
have been warmer.