

1.1 Phase Equilibria and Phase Behavior
3
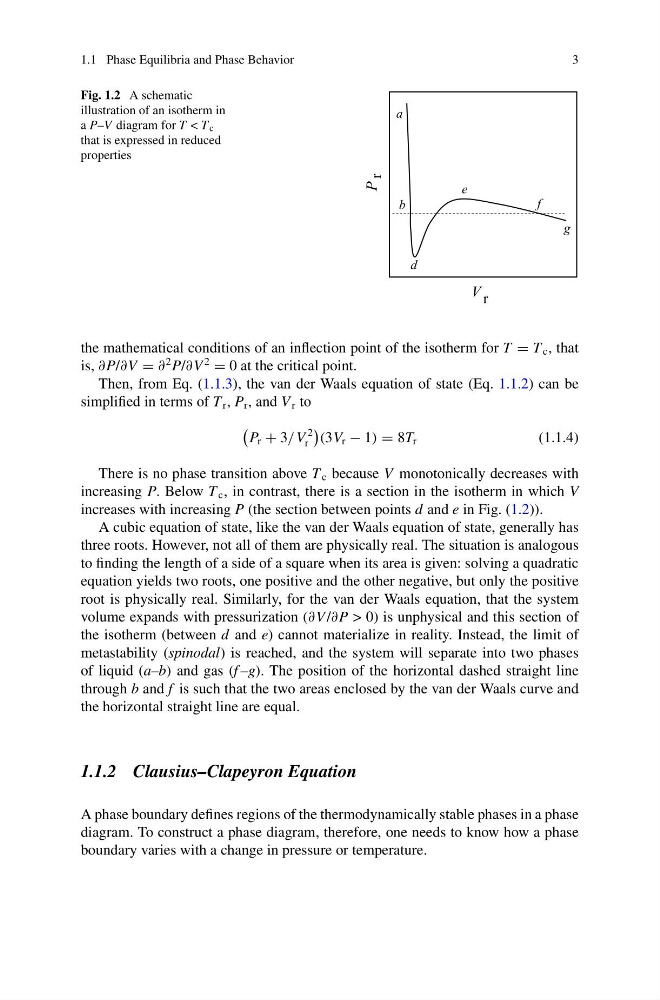
Fig. 1.2 A schematic
illustration of an isotherm in
a P–V diagram for T < T c
that is expressed in reduced
properties
V r
P
r
d
e
a
g
b
f
the mathematical conditions of an inflection point of the isotherm for T = T c , that
is, ∂P/∂V = ∂
2 P/∂V
2
= 0 at the critical point.
Then, from Eq. (1.1.3), the van der Waals equation of state (Eq. 1.1.2) can be
simplified in terms of T r , P r , and V r to
P r + 3/V
2
r
(3V r − 1) = 8T r
(1.1.4)
There is no phase transition above T c because V monotonically decreases with
increasing P. Below T c , in contrast, there is a section in the isotherm in which V
increases with increasing P (the section between points d and e in Fig. (1.2)).
A cubic equation of state, like the van der Waals equation of state, generally has
three roots. However, not all of them are physically real. The situation is analogous
to finding the length of a side of a square when its area is given: solving a quadratic
equation yields two roots, one positive and the other negative, but only the positive
root is physically real. Similarly, for the van der Waals equation, that the system
volume expands with pressurization (∂V /∂P > 0) is unphysical and this section of
the isotherm (between d and e) cannot materialize in reality. Instead, the limit of
metastability (spinodal) is reached, and the system will separate into two phases
of liquid (a–b) and gas (f –g). The position of the horizontal dashed straight line
through b and f is such that the two areas enclosed by the van der Waals curve and
the horizontal straight line are equal.
1.1.2 Clausius–Clapeyron Equation
A phase boundary defines regions of the thermodynamically stable phases in a phase
diagram. To construct a phase diagram, therefore, one needs to know how a phase
boundary varies with a change in pressure or temperature.
3
Fig. 1.2 A schematic
illustration of an isotherm in
a P–V diagram for T < T c
that is expressed in reduced
properties
V r
P
r
d
e
a
g
b
f
the mathematical conditions of an inflection point of the isotherm for T = T c , that
is, ∂P/∂V = ∂
2 P/∂V
2
= 0 at the critical point.
Then, from Eq. (1.1.3), the van der Waals equation of state (Eq. 1.1.2) can be
simplified in terms of T r , P r , and V r to
P r + 3/V
2
r
(3V r − 1) = 8T r
(1.1.4)
There is no phase transition above T c because V monotonically decreases with
increasing P. Below T c , in contrast, there is a section in the isotherm in which V
increases with increasing P (the section between points d and e in Fig. (1.2)).
A cubic equation of state, like the van der Waals equation of state, generally has
three roots. However, not all of them are physically real. The situation is analogous
to finding the length of a side of a square when its area is given: solving a quadratic
equation yields two roots, one positive and the other negative, but only the positive
root is physically real. Similarly, for the van der Waals equation, that the system
volume expands with pressurization (∂V /∂P > 0) is unphysical and this section of
the isotherm (between d and e) cannot materialize in reality. Instead, the limit of
metastability (spinodal) is reached, and the system will separate into two phases
of liquid (a–b) and gas (f –g). The position of the horizontal dashed straight line
through b and f is such that the two areas enclosed by the van der Waals curve and
the horizontal straight line are equal.
1.1.2 Clausius–Clapeyron Equation
A phase boundary defines regions of the thermodynamically stable phases in a phase
diagram. To construct a phase diagram, therefore, one needs to know how a phase
boundary varies with a change in pressure or temperature.