

10 A Novel High-Efficiency Keyhole Tungsten Inert Gas …
355
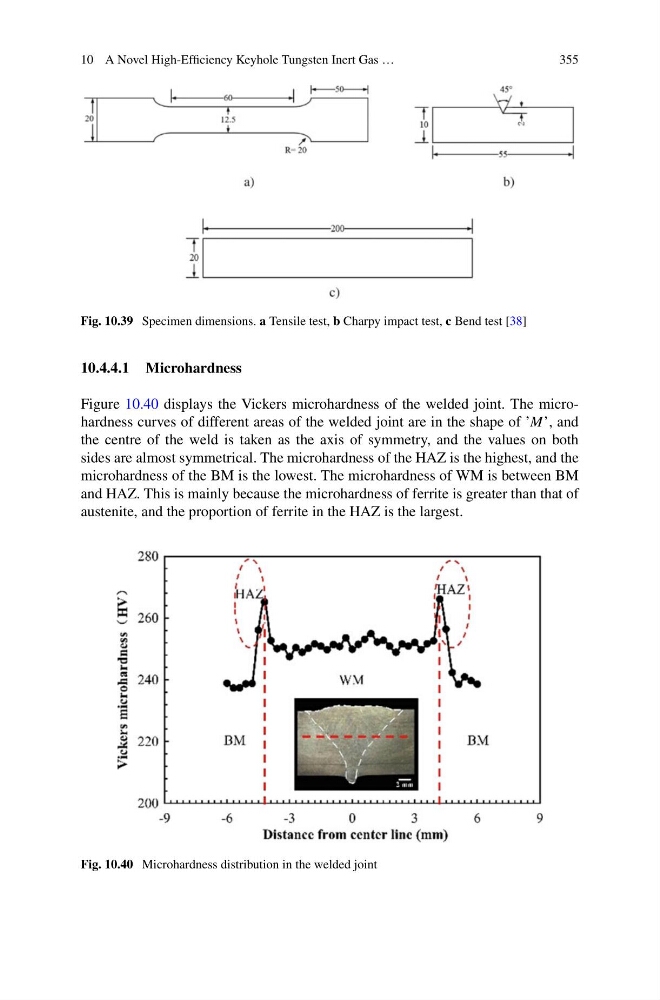
Fig. 10.39 Specimen dimensions. a Tensile test, b Charpy impact test, c Bend test [38]
10.4.4.1 Microhardness
Figure 10.40 displays the Vickers microhardness of the welded joint. The microhardness curves of different areas of the welded joint are in the shape of ’M’, and
the centre of the weld is taken as the axis of symmetry, and the values on both
sides are almost symmetrical. The microhardness of the HAZ is the highest, and the
microhardness of the BM is the lowest. The microhardness of WM is between BM
and HAZ. This is mainly because the microhardness of ferrite is greater than that of
austenite, and the proportion of ferrite in the HAZ is the largest.
Fig. 10.40 Microhardness distribution in the welded joint
355
Fig. 10.39 Specimen dimensions. a Tensile test, b Charpy impact test, c Bend test [38]
10.4.4.1 Microhardness
Figure 10.40 displays the Vickers microhardness of the welded joint. The microhardness curves of different areas of the welded joint are in the shape of ’M’, and
the centre of the weld is taken as the axis of symmetry, and the values on both
sides are almost symmetrical. The microhardness of the HAZ is the highest, and the
microhardness of the BM is the lowest. The microhardness of WM is between BM
and HAZ. This is mainly because the microhardness of ferrite is greater than that of
austenite, and the proportion of ferrite in the HAZ is the largest.
Fig. 10.40 Microhardness distribution in the welded joint