

10 A Novel High-Efficiency Keyhole Tungsten Inert Gas …
337
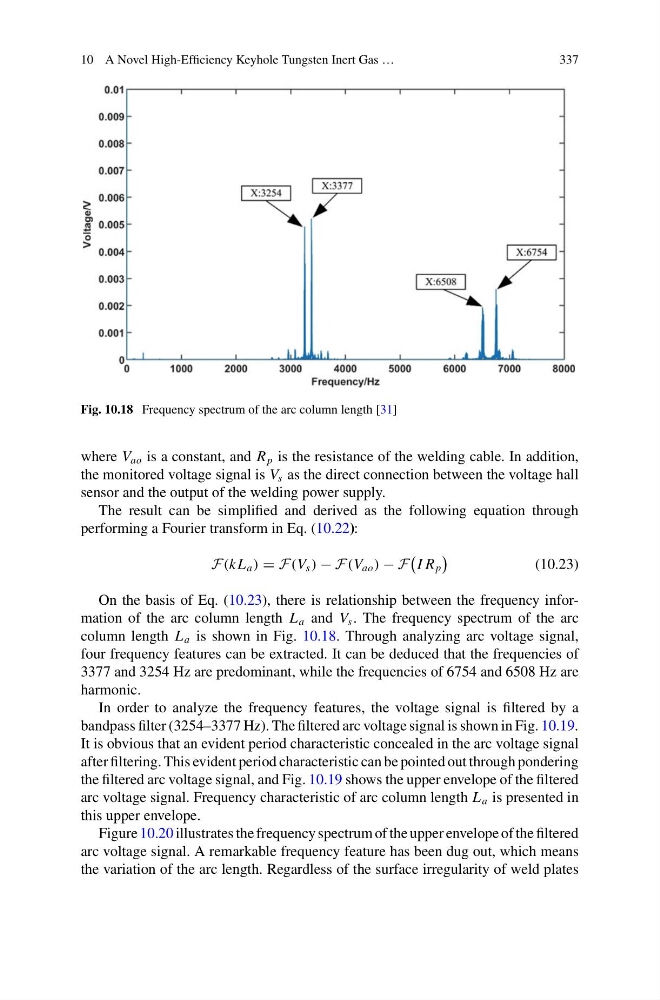
Fig. 10.18 Frequency spectrum of the arc column length [31]
where V ao is a constant, and R p is the resistance of the welding cable. In addition,
the monitored voltage signal is V s as the direct connection between the voltage hall
sensor and the output of the welding power supply.
The result can be simplified and derived as the following equation through
performing a Fourier transform in Eq. (10.22):
F(k L a ) = F(V s ) − F(V ao ) − F
I R p
(10.23)
On the basis of Eq. (10.23), there is relationship between the frequency information of the arc column length L a and V s . The frequency spectrum of the arc
column length L a is shown in Fig. 10.18. Through analyzing arc voltage signal,
four frequency features can be extracted. It can be deduced that the frequencies of
3377 and 3254 Hz are predominant, while the frequencies of 6754 and 6508 Hz are
harmonic.
In order to analyze the frequency features, the voltage signal is filtered by a
bandpass filter (3254–3377 Hz). The filtered arc voltage signal is shown in Fig. 10.19.
It is obvious that an evident period characteristic concealed in the arc voltage signal
after filtering. This evident period characteristic can be pointed out through pondering
the filtered arc voltage signal, and Fig. 10.19 shows the upper envelope of the filtered
arc voltage signal. Frequency characteristic of arc column length L a is presented in
this upper envelope.
Figure 10.20 illustrates the frequency spectrum of the upper envelope of the filtered
arc voltage signal. A remarkable frequency feature has been dug out, which means
the variation of the arc length. Regardless of the surface irregularity of weld plates
337
Fig. 10.18 Frequency spectrum of the arc column length [31]
where V ao is a constant, and R p is the resistance of the welding cable. In addition,
the monitored voltage signal is V s as the direct connection between the voltage hall
sensor and the output of the welding power supply.
The result can be simplified and derived as the following equation through
performing a Fourier transform in Eq. (10.22):
F(k L a ) = F(V s ) − F(V ao ) − F
I R p
(10.23)
On the basis of Eq. (10.23), there is relationship between the frequency information of the arc column length L a and V s . The frequency spectrum of the arc
column length L a is shown in Fig. 10.18. Through analyzing arc voltage signal,
four frequency features can be extracted. It can be deduced that the frequencies of
3377 and 3254 Hz are predominant, while the frequencies of 6754 and 6508 Hz are
harmonic.
In order to analyze the frequency features, the voltage signal is filtered by a
bandpass filter (3254–3377 Hz). The filtered arc voltage signal is shown in Fig. 10.19.
It is obvious that an evident period characteristic concealed in the arc voltage signal
after filtering. This evident period characteristic can be pointed out through pondering
the filtered arc voltage signal, and Fig. 10.19 shows the upper envelope of the filtered
arc voltage signal. Frequency characteristic of arc column length L a is presented in
this upper envelope.
Figure 10.20 illustrates the frequency spectrum of the upper envelope of the filtered
arc voltage signal. A remarkable frequency feature has been dug out, which means
the variation of the arc length. Regardless of the surface irregularity of weld plates