

10 A Novel High-Efficiency Keyhole Tungsten Inert Gas …
333
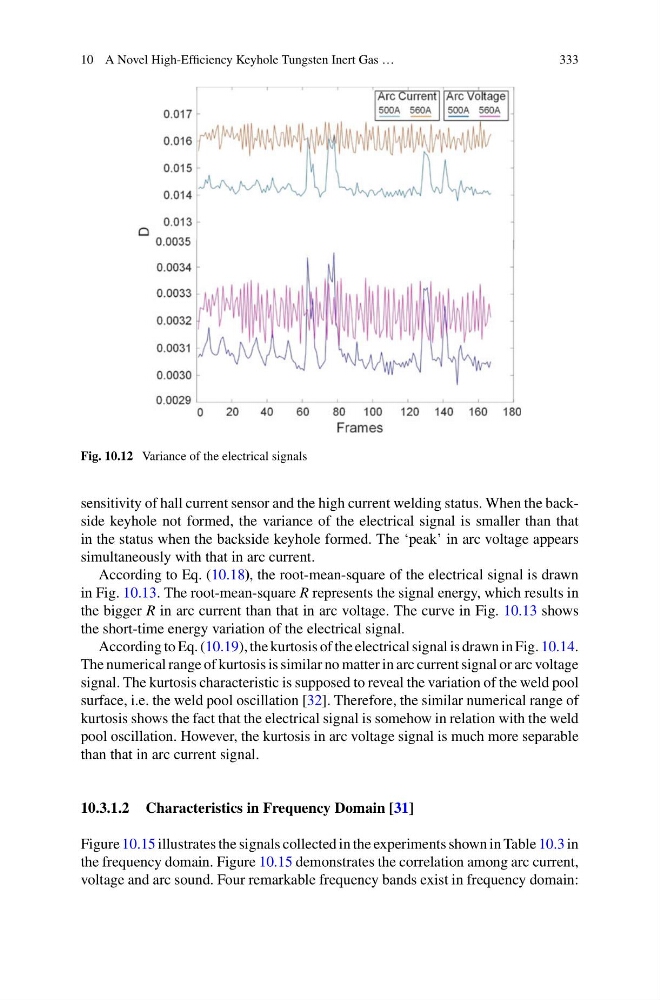
Fig. 10.12 Variance of the electrical signals
sensitivity of hall current sensor and the high current welding status. When the backside keyhole not formed, the variance of the electrical signal is smaller than that
in the status when the backside keyhole formed. The ‘peak’ in arc voltage appears
simultaneously with that in arc current.
According to Eq. (10.18), the root-mean-square of the electrical signal is drawn
in Fig. 10.13. The root-mean-square R represents the signal energy, which results in
the bigger R in arc current than that in arc voltage. The curve in Fig. 10.13 shows
the short-time energy variation of the electrical signal.
According to Eq. (10.19), the kurtosis of the electrical signal is drawn in Fig. 10.14.
The numerical range of kurtosis is similar no matter in arc current signal or arc voltage
signal. The kurtosis characteristic is supposed to reveal the variation of the weld pool
surface, i.e. the weld pool oscillation [32]. Therefore, the similar numerical range of
kurtosis shows the fact that the electrical signal is somehow in relation with the weld
pool oscillation. However, the kurtosis in arc voltage signal is much more separable
than that in arc current signal.
10.3.1.2 Characteristics in Frequency Domain [31]
Figure 10.15 illustrates the signals collected in the experiments shown in Table 10.3 in
the frequency domain. Figure 10.15 demonstrates the correlation among arc current,
voltage and arc sound. Four remarkable frequency bands exist in frequency domain:
333
Fig. 10.12 Variance of the electrical signals
sensitivity of hall current sensor and the high current welding status. When the backside keyhole not formed, the variance of the electrical signal is smaller than that
in the status when the backside keyhole formed. The ‘peak’ in arc voltage appears
simultaneously with that in arc current.
According to Eq. (10.18), the root-mean-square of the electrical signal is drawn
in Fig. 10.13. The root-mean-square R represents the signal energy, which results in
the bigger R in arc current than that in arc voltage. The curve in Fig. 10.13 shows
the short-time energy variation of the electrical signal.
According to Eq. (10.19), the kurtosis of the electrical signal is drawn in Fig. 10.14.
The numerical range of kurtosis is similar no matter in arc current signal or arc voltage
signal. The kurtosis characteristic is supposed to reveal the variation of the weld pool
surface, i.e. the weld pool oscillation [32]. Therefore, the similar numerical range of
kurtosis shows the fact that the electrical signal is somehow in relation with the weld
pool oscillation. However, the kurtosis in arc voltage signal is much more separable
than that in arc current signal.
10.3.1.2 Characteristics in Frequency Domain [31]
Figure 10.15 illustrates the signals collected in the experiments shown in Table 10.3 in
the frequency domain. Figure 10.15 demonstrates the correlation among arc current,
voltage and arc sound. Four remarkable frequency bands exist in frequency domain: