

9 Comparative Study of Laser Weldability of Titanium Alloys
301
9.2 Experimental Procedure
Butt welding treatments were performed on samples of three titanium alloys, whose
composition is detailed in Table 9.1. The size of titanium samples were 50 mm ×
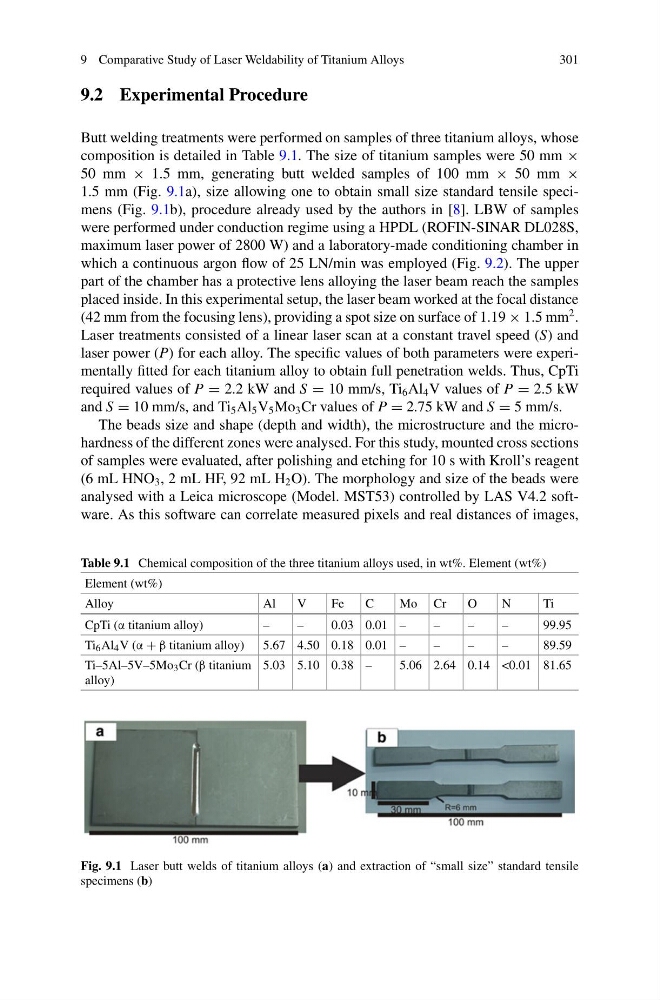
50 mm × 1.5 mm, generating butt welded samples of 100 mm × 50 mm ×
1.5 mm (Fig. 9.1a), size allowing one to obtain small size standard tensile specimens (Fig. 9.1b), procedure already used by the authors in [8]. LBW of samples
were performed under conduction regime using a HPDL (ROFIN-SINAR DL028S,
maximum laser power of 2800 W) and a laboratory-made conditioning chamber in
which a continuous argon flow of 25 LN/min was employed (Fig. 9.2). The upper
part of the chamber has a protective lens alloying the laser beam reach the samples
placed inside. In this experimental setup, the laser beam worked at the focal distance
(42 mm from the focusing lens), providing a spot size on surface of 1.19 × 1.5 mm
2 .
Laser treatments consisted of a linear laser scan at a constant travel speed (S) and
laser power (P) for each alloy. The specific values of both parameters were experimentally fitted for each titanium alloy to obtain full penetration welds. Thus, CpTi
required values of P = 2.2 kW and S = 10 mm/s, Ti 6 Al 4 V values of P = 2.5 kW
and S = 10 mm/s, and Ti 5 Al 5 V 5 Mo 3 Cr values of P = 2.75 kW and S = 5 mm/s.
The beads size and shape (depth and width), the microstructure and the microhardness of the different zones were analysed. For this study, mounted cross sections
of samples were evaluated, after polishing and etching for 10 s with Kroll’s reagent
(6 mL HNO 3 , 2 mL HF, 92 mL H 2 O). The morphology and size of the beads were
analysed with a Leica microscope (Model. MST53) controlled by LAS V4.2 software. As this software can correlate measured pixels and real distances of images,
Table 9.1 Chemical composition of the three titanium alloys used, in wt%. Element (wt%)
Element (wt%)
Alloy
Al
V
Fe
C
Mo Cr
O
N
Ti
CpTi (α titanium alloy)
–
–
0.03 0.01 –
–
–
–
99.95
Ti 6 Al 4 V (α + β titanium alloy) 5.67 4.50 0.18 0.01 –
–
–
–
89.59
Ti–5Al–5V–5Mo 3 Cr (β titanium
alloy)
5.03 5.10 0.38 –
5.06 2.64 0.14 <0.01 81.65
Fig. 9.1 Laser butt welds of titanium alloys (a) and extraction of “small size” standard tensile
specimens (b)
301
9.2 Experimental Procedure
Butt welding treatments were performed on samples of three titanium alloys, whose
composition is detailed in Table 9.1. The size of titanium samples were 50 mm ×
50 mm × 1.5 mm, generating butt welded samples of 100 mm × 50 mm ×
1.5 mm (Fig. 9.1a), size allowing one to obtain small size standard tensile specimens (Fig. 9.1b), procedure already used by the authors in [8]. LBW of samples
were performed under conduction regime using a HPDL (ROFIN-SINAR DL028S,
maximum laser power of 2800 W) and a laboratory-made conditioning chamber in
which a continuous argon flow of 25 LN/min was employed (Fig. 9.2). The upper
part of the chamber has a protective lens alloying the laser beam reach the samples
placed inside. In this experimental setup, the laser beam worked at the focal distance
(42 mm from the focusing lens), providing a spot size on surface of 1.19 × 1.5 mm
2 .
Laser treatments consisted of a linear laser scan at a constant travel speed (S) and
laser power (P) for each alloy. The specific values of both parameters were experimentally fitted for each titanium alloy to obtain full penetration welds. Thus, CpTi
required values of P = 2.2 kW and S = 10 mm/s, Ti 6 Al 4 V values of P = 2.5 kW
and S = 10 mm/s, and Ti 5 Al 5 V 5 Mo 3 Cr values of P = 2.75 kW and S = 5 mm/s.
The beads size and shape (depth and width), the microstructure and the microhardness of the different zones were analysed. For this study, mounted cross sections
of samples were evaluated, after polishing and etching for 10 s with Kroll’s reagent
(6 mL HNO 3 , 2 mL HF, 92 mL H 2 O). The morphology and size of the beads were
analysed with a Leica microscope (Model. MST53) controlled by LAS V4.2 software. As this software can correlate measured pixels and real distances of images,
Table 9.1 Chemical composition of the three titanium alloys used, in wt%. Element (wt%)
Element (wt%)
Alloy
Al
V
Fe
C
Mo Cr
O
N
Ti
CpTi (α titanium alloy)
–
–
0.03 0.01 –
–
–
–
99.95
Ti 6 Al 4 V (α + β titanium alloy) 5.67 4.50 0.18 0.01 –
–
–
–
89.59
Ti–5Al–5V–5Mo 3 Cr (β titanium
alloy)
5.03 5.10 0.38 –
5.06 2.64 0.14 <0.01 81.65
Fig. 9.1 Laser butt welds of titanium alloys (a) and extraction of “small size” standard tensile
specimens (b)