

290
D. Mishra et al.
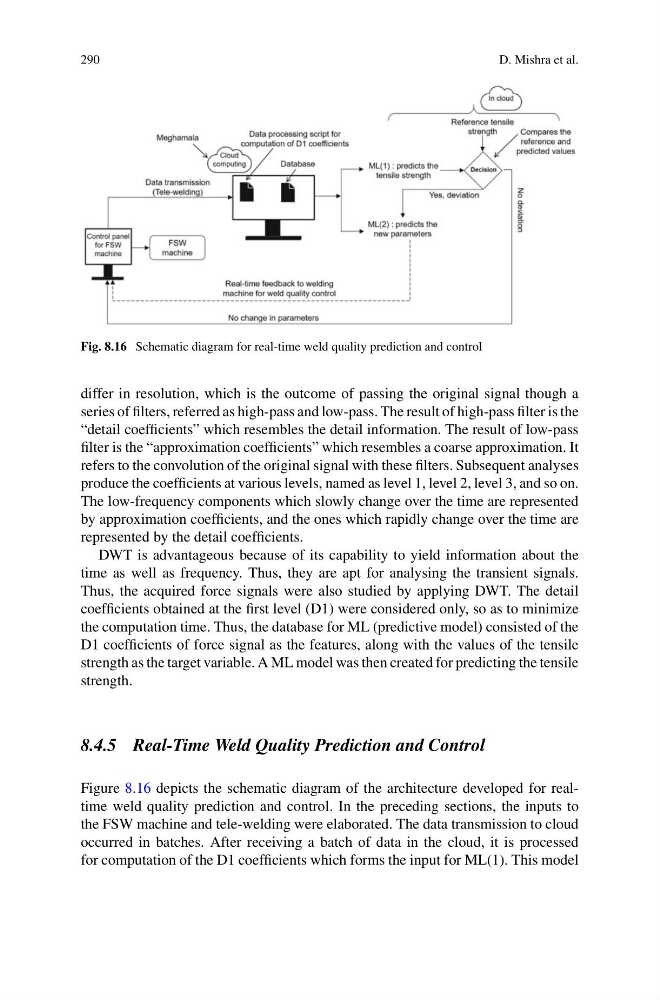
Fig. 8.16 Schematic diagram for real-time weld quality prediction and control
differ in resolution, which is the outcome of passing the original signal though a
series of filters, referred as high-pass and low-pass. The result of high-pass filter is the
“detail coefficients” which resembles the detail information. The result of low-pass
filter is the “approximation coefficients” which resembles a coarse approximation. It
refers to the convolution of the original signal with these filters. Subsequent analyses
produce the coefficients at various levels, named as level 1, level 2, level 3, and so on.
The low-frequency components which slowly change over the time are represented
by approximation coefficients, and the ones which rapidly change over the time are
represented by the detail coefficients.
DWT is advantageous because of its capability to yield information about the
time as well as frequency. Thus, they are apt for analysing the transient signals.
Thus, the acquired force signals were also studied by applying DWT. The detail
coefficients obtained at the first level (D1) were considered only, so as to minimize
the computation time. Thus, the database for ML (predictive model) consisted of the
D1 coefficients of force signal as the features, along with the values of the tensile
strength as the target variable. A ML model was then created for predicting the tensile
strength.
8.4.5 Real-Time Weld Quality Prediction and Control
Figure 8.16 depicts the schematic diagram of the architecture developed for realtime weld quality prediction and control. In the preceding sections, the inputs to
the FSW machine and tele-welding were elaborated. The data transmission to cloud
occurred in batches. After receiving a batch of data in the cloud, it is processed
for computation of the D1 coefficients which forms the input for ML(1). This model
D. Mishra et al.
Fig. 8.16 Schematic diagram for real-time weld quality prediction and control
differ in resolution, which is the outcome of passing the original signal though a
series of filters, referred as high-pass and low-pass. The result of high-pass filter is the
“detail coefficients” which resembles the detail information. The result of low-pass
filter is the “approximation coefficients” which resembles a coarse approximation. It
refers to the convolution of the original signal with these filters. Subsequent analyses
produce the coefficients at various levels, named as level 1, level 2, level 3, and so on.
The low-frequency components which slowly change over the time are represented
by approximation coefficients, and the ones which rapidly change over the time are
represented by the detail coefficients.
DWT is advantageous because of its capability to yield information about the
time as well as frequency. Thus, they are apt for analysing the transient signals.
Thus, the acquired force signals were also studied by applying DWT. The detail
coefficients obtained at the first level (D1) were considered only, so as to minimize
the computation time. Thus, the database for ML (predictive model) consisted of the
D1 coefficients of force signal as the features, along with the values of the tensile
strength as the target variable. A ML model was then created for predicting the tensile
strength.
8.4.5 Real-Time Weld Quality Prediction and Control
Figure 8.16 depicts the schematic diagram of the architecture developed for realtime weld quality prediction and control. In the preceding sections, the inputs to
the FSW machine and tele-welding were elaborated. The data transmission to cloud
occurred in batches. After receiving a batch of data in the cloud, it is processed
for computation of the D1 coefficients which forms the input for ML(1). This model