

6 Microstructure and Texture in Welding: A Case Study on Friction Stir Welding
223
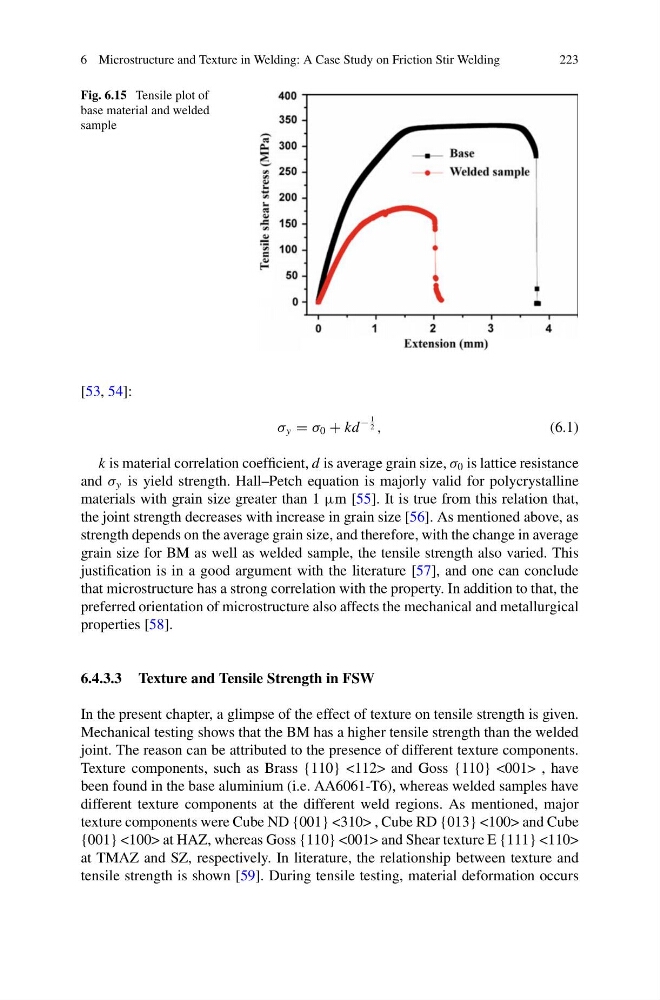
Fig. 6.15 Tensile plot of
base material and welded
sample
[53, 54]:
σ y = σ 0 + kd
−
1
2 ,
(6.1)
k is material correlation coefficient, d is average grain size, σ 0 is lattice resistance
and σ y is yield strength. Hall–Petch equation is majorly valid for polycrystalline
materials with grain size greater than 1 µm [55]. It is true from this relation that,
the joint strength decreases with increase in grain size [56]. As mentioned above, as
strength depends on the average grain size, and therefore, with the change in average
grain size for BM as well as welded sample, the tensile strength also varied. This
justification is in a good argument with the literature [57], and one can conclude
that microstructure has a strong correlation with the property. In addition to that, the
preferred orientation of microstructure also affects the mechanical and metallurgical
properties [58].
6.4.3.3 Texture and Tensile Strength in FSW
In the present chapter, a glimpse of the effect of texture on tensile strength is given.
Mechanical testing shows that the BM has a higher tensile strength than the welded
joint. The reason can be attributed to the presence of different texture components.
Texture components, such as Brass {110} <112> and Goss {110} <001> , have
been found in the base aluminium (i.e. AA6061-T6), whereas welded samples have
different texture components at the different weld regions. As mentioned, major
texture components were Cube ND {001} <310> , Cube RD {013} <100> and Cube
{001} <100> at HAZ, whereas Goss {110} <001> and Shear texture E {111} <110>
at TMAZ and SZ, respectively. In literature, the relationship between texture and
tensile strength is shown [59]. During tensile testing, material deformation occurs
223
Fig. 6.15 Tensile plot of
base material and welded
sample
[53, 54]:
σ y = σ 0 + kd
−
1
2 ,
(6.1)
k is material correlation coefficient, d is average grain size, σ 0 is lattice resistance
and σ y is yield strength. Hall–Petch equation is majorly valid for polycrystalline
materials with grain size greater than 1 µm [55]. It is true from this relation that,
the joint strength decreases with increase in grain size [56]. As mentioned above, as
strength depends on the average grain size, and therefore, with the change in average
grain size for BM as well as welded sample, the tensile strength also varied. This
justification is in a good argument with the literature [57], and one can conclude
that microstructure has a strong correlation with the property. In addition to that, the
preferred orientation of microstructure also affects the mechanical and metallurgical
properties [58].
6.4.3.3 Texture and Tensile Strength in FSW
In the present chapter, a glimpse of the effect of texture on tensile strength is given.
Mechanical testing shows that the BM has a higher tensile strength than the welded
joint. The reason can be attributed to the presence of different texture components.
Texture components, such as Brass {110} <112> and Goss {110} <001> , have
been found in the base aluminium (i.e. AA6061-T6), whereas welded samples have
different texture components at the different weld regions. As mentioned, major
texture components were Cube ND {001} <310> , Cube RD {013} <100> and Cube
{001} <100> at HAZ, whereas Goss {110} <001> and Shear texture E {111} <110>
at TMAZ and SZ, respectively. In literature, the relationship between texture and
tensile strength is shown [59]. During tensile testing, material deformation occurs