

For typical tokamak edge plasma parameters we find U max ~ 1 km/s, which is,
in a ballpark, consistent with the experimental observations (e.g. see [124, 131]).
For sheath-limited parallel electric current, the scaling for the blob velocity reads
U b / δ
À2
b [100]. The available experimental data seem to support both these scalings
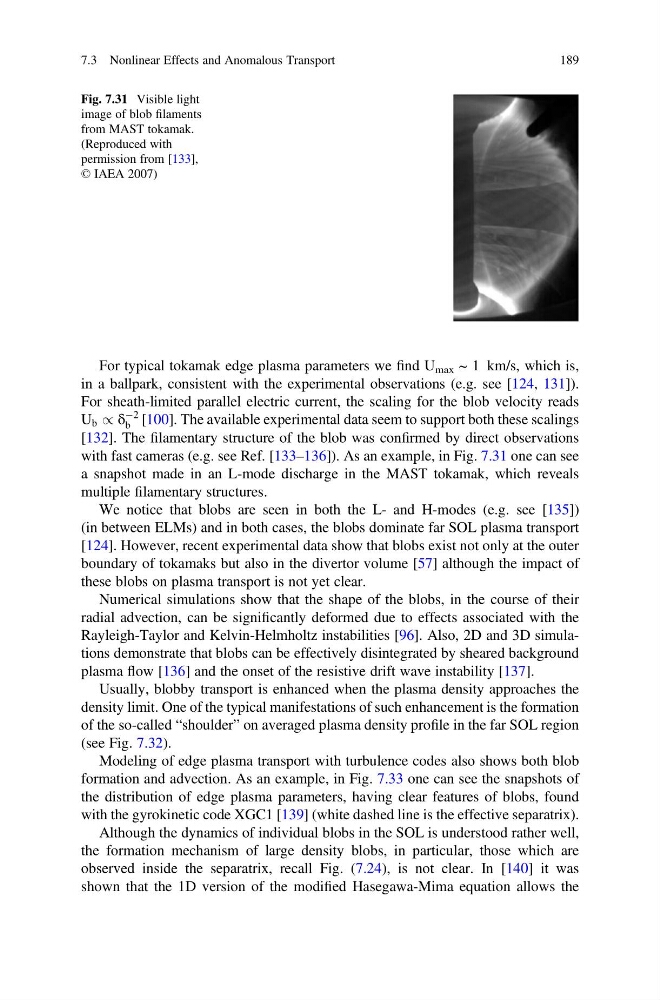
[132]. The filamentary structure of the blob was confirmed by direct observations
with fast cameras (e.g. see Ref. [133–136]). As an example, in Fig. 7.31 one can see
a snapshot made in an L-mode discharge in the MAST tokamak, which reveals
multiple filamentary structures.
We notice that blobs are seen in both the L- and H-modes (e.g. see [135])
(in between ELMs) and in both cases, the blobs dominate far SOL plasma transport
[124]. However, recent experimental data show that blobs exist not only at the outer
boundary of tokamaks but also in the divertor volume [57] although the impact of
these blobs on plasma transport is not yet clear.
Numerical simulations show that the shape of the blobs, in the course of their
radial advection, can be significantly deformed due to effects associated with the
Rayleigh-Taylor and Kelvin-Helmholtz instabilities [96]. Also, 2D and 3D simulations demonstrate that blobs can be effectively disintegrated by sheared background
plasma flow [136] and the onset of the resistive drift wave instability [137].
Usually, blobby transport is enhanced when the plasma density approaches the
density limit. One of the typical manifestations of such enhancement is the formation
of the so-called “shoulder” on averaged plasma density profile in the far SOL region
(see Fig. 7.32).
Modeling of edge plasma transport with turbulence codes also shows both blob
formation and advection. As an example, in Fig. 7.33 one can see the snapshots of
the distribution of edge plasma parameters, having clear features of blobs, found
with the gyrokinetic code XGC1 [139] (white dashed line is the effective separatrix).
Although the dynamics of individual blobs in the SOL is understood rather well,
the formation mechanism of large density blobs, in particular, those which are
observed inside the separatrix, recall Fig. (7.24), is not clear. In [140] it was
shown that the 1D version of the modified Hasegawa-Mima equation allows the
Fig. 7.31 Visible light
image of blob filaments
from MAST tokamak.
(Reproduced with
permission from [133],
© IAEA 2007)
7.3 Nonlinear Effects and Anomalous Transport
189
in a ballpark, consistent with the experimental observations (e.g. see [124, 131]).
For sheath-limited parallel electric current, the scaling for the blob velocity reads
U b / δ
À2
b [100]. The available experimental data seem to support both these scalings
[132]. The filamentary structure of the blob was confirmed by direct observations
with fast cameras (e.g. see Ref. [133–136]). As an example, in Fig. 7.31 one can see
a snapshot made in an L-mode discharge in the MAST tokamak, which reveals
multiple filamentary structures.
We notice that blobs are seen in both the L- and H-modes (e.g. see [135])
(in between ELMs) and in both cases, the blobs dominate far SOL plasma transport
[124]. However, recent experimental data show that blobs exist not only at the outer
boundary of tokamaks but also in the divertor volume [57] although the impact of
these blobs on plasma transport is not yet clear.
Numerical simulations show that the shape of the blobs, in the course of their
radial advection, can be significantly deformed due to effects associated with the
Rayleigh-Taylor and Kelvin-Helmholtz instabilities [96]. Also, 2D and 3D simulations demonstrate that blobs can be effectively disintegrated by sheared background
plasma flow [136] and the onset of the resistive drift wave instability [137].
Usually, blobby transport is enhanced when the plasma density approaches the
density limit. One of the typical manifestations of such enhancement is the formation
of the so-called “shoulder” on averaged plasma density profile in the far SOL region
(see Fig. 7.32).
Modeling of edge plasma transport with turbulence codes also shows both blob
formation and advection. As an example, in Fig. 7.33 one can see the snapshots of
the distribution of edge plasma parameters, having clear features of blobs, found
with the gyrokinetic code XGC1 [139] (white dashed line is the effective separatrix).
Although the dynamics of individual blobs in the SOL is understood rather well,
the formation mechanism of large density blobs, in particular, those which are
observed inside the separatrix, recall Fig. (7.24), is not clear. In [140] it was
shown that the 1D version of the modified Hasegawa-Mima equation allows the
Fig. 7.31 Visible light
image of blob filaments
from MAST tokamak.
(Reproduced with
permission from [133],
© IAEA 2007)
7.3 Nonlinear Effects and Anomalous Transport
189