

7.3.2 “Blobs”
Meso-scale plasma structures which are now called blobs were occasionally
observed experimentally for a long time as, in particular, large spikes of the ion
saturation current collected by electrostatic probes at the edge of tokamaks (e.g. see
[123] and Fig. 7.29).
However, only after a very large plasma particle flux to the main chamber wall
was discovered in the C-Mod tokamak [125] and it became clear that such a flux is
1
0
0.1
0.2
0.3
0.4
0.5
s
0.6
0.7
0.8
0.9
0
0.1
0.2
0.3
0.4
0.5
s
0.6
0.7
0.8
0.9
2
t [Ω i
–1 ]
χ/χ GB0
ω E×B [c s /a] 2G extfilt
3
4
5
6
7
8
0
–1
–0.5
0
0.5
1
1
2
3
4
5
9
×10 5
1
0
2
t [Ω i
–1 ]
3
4
5
6
7
8
9
×10 5
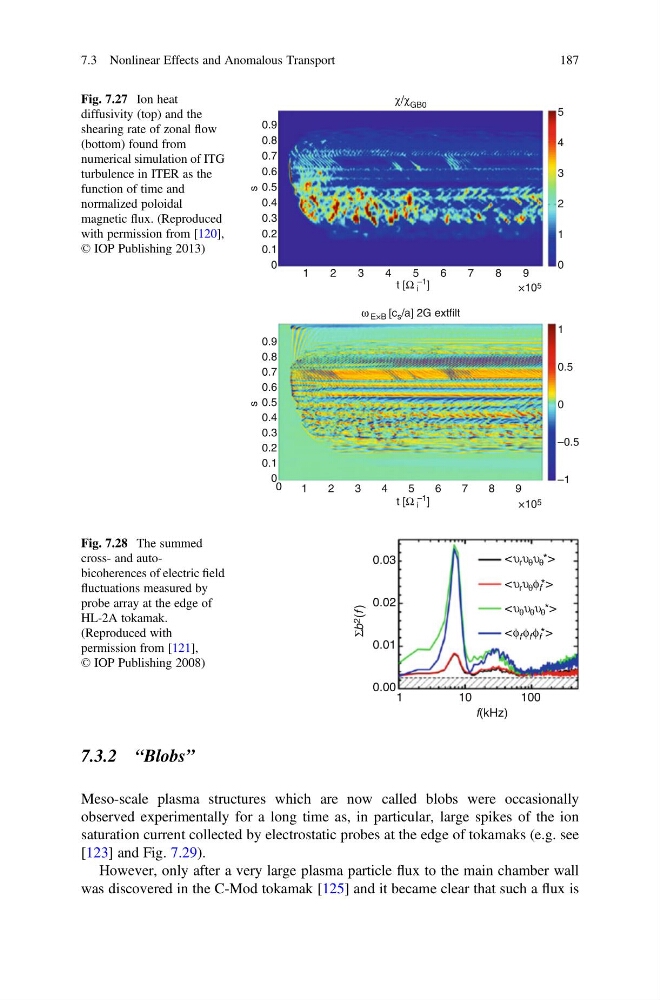
Fig. 7.27 Ion heat
diffusivity (top) and the
shearing rate of zonal flow
(bottom) found from
numerical simulation of ITG
turbulence in ITER as the
function of time and
normalized poloidal
magnetic flux. (Reproduced
with permission from [120],
© IOP Publishing 2013)
1
10
100
0.00
0.01
0.02
0.03
f(kHz)
<υ r υ θ υ θ *>
<υ r υ θ φ f *>
<υ θ υ θ υ θ *>
<φ f φ f φ f *>
Σb 2
(f )
Fig. 7.28 The summed
cross- and autobicoherences of electric field
fluctuations measured by
probe array at the edge of
HL-2A tokamak.
(Reproduced with
permission from [121],
© IOP Publishing 2008)
7.3 Nonlinear Effects and Anomalous Transport
187
Meso-scale plasma structures which are now called blobs were occasionally
observed experimentally for a long time as, in particular, large spikes of the ion
saturation current collected by electrostatic probes at the edge of tokamaks (e.g. see
[123] and Fig. 7.29).
However, only after a very large plasma particle flux to the main chamber wall
was discovered in the C-Mod tokamak [125] and it became clear that such a flux is
1
0
0.1
0.2
0.3
0.4
0.5
s
0.6
0.7
0.8
0.9
0
0.1
0.2
0.3
0.4
0.5
s
0.6
0.7
0.8
0.9
2
t [Ω i
–1 ]
χ/χ GB0
ω E×B [c s /a] 2G extfilt
3
4
5
6
7
8
0
–1
–0.5
0
0.5
1
1
2
3
4
5
9
×10 5
1
0
2
t [Ω i
–1 ]
3
4
5
6
7
8
9
×10 5
Fig. 7.27 Ion heat
diffusivity (top) and the
shearing rate of zonal flow
(bottom) found from
numerical simulation of ITG
turbulence in ITER as the
function of time and
normalized poloidal
magnetic flux. (Reproduced
with permission from [120],
© IOP Publishing 2013)
1
10
100
0.00
0.01
0.02
0.03
f(kHz)
<υ r υ θ υ θ *>
<υ r υ θ φ f *>
<υ θ υ θ υ θ *>
<φ f φ f φ f *>
Σb 2
(f )
Fig. 7.28 The summed
cross- and autobicoherences of electric field
fluctuations measured by
probe array at the edge of
HL-2A tokamak.
(Reproduced with
permission from [121],
© IOP Publishing 2008)
7.3 Nonlinear Effects and Anomalous Transport
187