

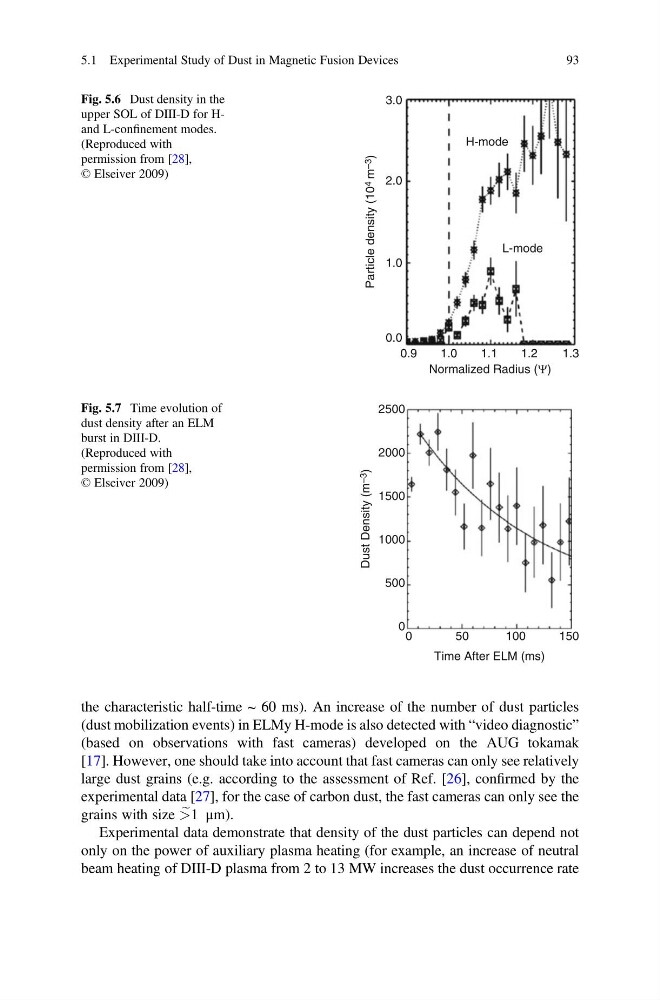
the characteristic half-time ~ 60 ms). An increase of the number of dust particles
(dust mobilization events) in ELMy H-mode is also detected with “video diagnostic”
(based on observations with fast cameras) developed on the AUG tokamak
[17]. However, one should take into account that fast cameras can only see relatively
large dust grains (e.g. according to the assessment of Ref. [26], confirmed by the
experimental data [27], for the case of carbon dust, the fast cameras can only see the
grains with size e
>1 μm).
Experimental data demonstrate that density of the dust particles can depend not
only on the power of auxiliary plasma heating (for example, an increase of neutral
beam heating of DIII-D plasma from 2 to 13 MW increases the dust occurrence rate
0.9
Particle density (10 4
m –3
)
Normalized Radius (Ψ)
L-mode
H-mode
1.0
1.1
1.2
1.3
0.0
1.0
2.0
3.0
Fig. 5.6 Dust density in the
upper SOL of DIII-D for Hand L-confinement modes.
(Reproduced with
permission from [28],
© Elseiver 2009)
0
5 0
Time After ELM (ms)
Dust Density (m –3
)
100
150
0
500
1000
1500
2000
2500
Fig. 5.7 Time evolution of
dust density after an ELM
burst in DIII-D.
(Reproduced with
permission from [28],
© Elseiver 2009)
5.1 Experimental Study of Dust in Magnetic Fusion Devices
93
(dust mobilization events) in ELMy H-mode is also detected with “video diagnostic”
(based on observations with fast cameras) developed on the AUG tokamak
[17]. However, one should take into account that fast cameras can only see relatively
large dust grains (e.g. according to the assessment of Ref. [26], confirmed by the
experimental data [27], for the case of carbon dust, the fast cameras can only see the
grains with size e
>1 μm).
Experimental data demonstrate that density of the dust particles can depend not
only on the power of auxiliary plasma heating (for example, an increase of neutral
beam heating of DIII-D plasma from 2 to 13 MW increases the dust occurrence rate
0.9
Particle density (10 4
m –3
)
Normalized Radius (Ψ)
L-mode
H-mode
1.0
1.1
1.2
1.3
0.0
1.0
2.0
3.0
Fig. 5.6 Dust density in the
upper SOL of DIII-D for Hand L-confinement modes.
(Reproduced with
permission from [28],
© Elseiver 2009)
0
5 0
Time After ELM (ms)
Dust Density (m –3
)
100
150
0
500
1000
1500
2000
2500
Fig. 5.7 Time evolution of
dust density after an ELM
burst in DIII-D.
(Reproduced with
permission from [28],
© Elseiver 2009)
5.1 Experimental Study of Dust in Magnetic Fusion Devices
93