

In 2011, Germany’s KfW bank announced that it would make available €100 billion
(US$120–130 billion) over the following five years to promote renewable energies
and contribute to Germany’s Energiewende plan (‘Energy Turnaround’), which will
promote the complete decommissioning of the country’s nuclear power plants by
2022 (OGFJ, 2011; Reuters, 2012). Indeed, in 2012 KfW was the top development
bank in terms of clean energy investments, with its total commitments amounting
to US$34 billion (Louw, 2013, p6). In China, investments by the China Develop -
ment Bank (CDB) are a key source of its success in solar power. CDB funding to
green energy projects in general is indeed generous: between 2007 and 2012, CDB
committed US$78 billion to clean energy, US$26 billion in 2012 alone (Louw,
2013, p6). The CDB extended US$47 billion after 2010 to approximately 15 leading
Chinese solar PV manufacturers to finance their current and future expansion needs,
though firms had drawn on approximately US$866 million in 2011 (Bakewell,
2011). The rapid scaling of solar PV manufacturing firms made possible by public
finance has quickly established Chinese solar technology manufacturers as major
international players. As such, they are able to slash the cost of solar PV panels so
quickly that much of the financial media argues that this access to credit is the
reason behind bankruptcies of solar companies based in the United States and Europe
(e.g. Forbes, 2011). The Brazilian Development Bank (BNDES) approved over
US$4.23 billion in clean technology financing in 2011 (Fried et al., 2012, p5). Today,
state investment banks are spending over US$100 billion annually on energy
efficiency and renewable projects (Louw, 2013), while clean energy project bond
issuance reached just US$3.2 billion in 2013 (FS-UNEP/BNEF, 2014, p44).
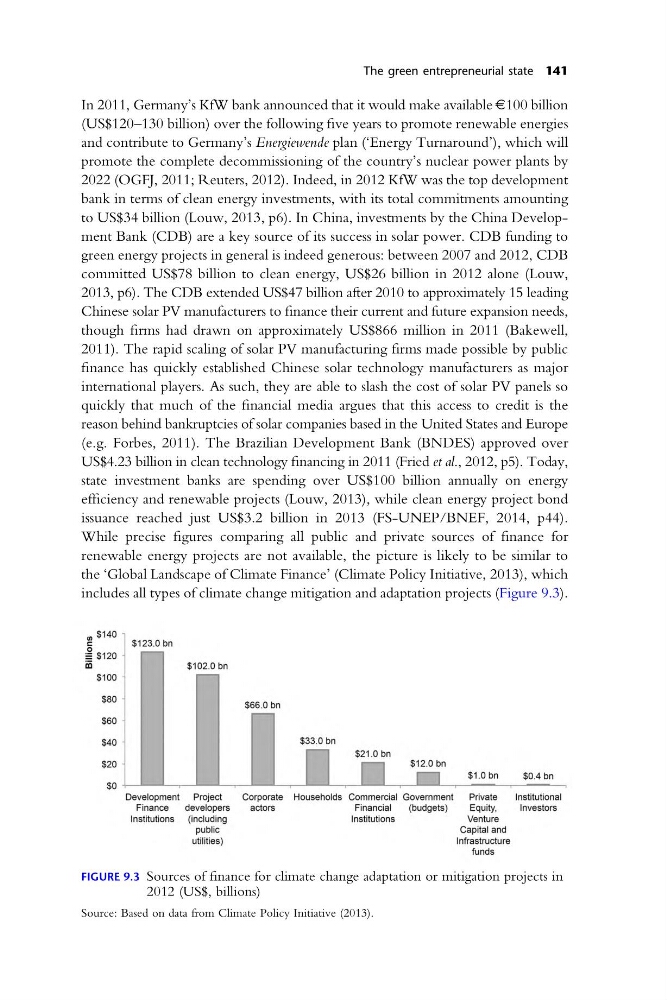
While precise figures comparing all public and private sources of finance for
renewable energy projects are not available, the picture is likely to be similar to
the ‘Global Landscape of Climate Finance’ (Climate Policy Initiative, 2013), which
includes all types of climate change mitigation and adaptation projects (Figure 9.3).
The green entrepreneurial state 141
FIGURE 9.3 Sources of finance for climate change adaptation or mitigation projects in
2012 (US$, billions)
Source: Based on data from Climate Policy Initiative (2013).
B illio n s
$123.0 bn
$102.0 bn
$66.0 bn
$33.0 bn
$21.0 bn
$12.0 bn
$1.0 bn
Development
Project
Finance
developers
Institutions
(including
public
utilities)
Corporate Households Commercial Government
Private
actors
Financial
(budgets)
Equity,
Institutions
Venture
Capital and
Infrastructure
funds
$0.4 bn
Institutional
Investors
$140
$120
$100
$80
$60
$40
$20
$0
(US$120–130 billion) over the following five years to promote renewable energies
and contribute to Germany’s Energiewende plan (‘Energy Turnaround’), which will
promote the complete decommissioning of the country’s nuclear power plants by
2022 (OGFJ, 2011; Reuters, 2012). Indeed, in 2012 KfW was the top development
bank in terms of clean energy investments, with its total commitments amounting
to US$34 billion (Louw, 2013, p6). In China, investments by the China Develop -
ment Bank (CDB) are a key source of its success in solar power. CDB funding to
green energy projects in general is indeed generous: between 2007 and 2012, CDB
committed US$78 billion to clean energy, US$26 billion in 2012 alone (Louw,
2013, p6). The CDB extended US$47 billion after 2010 to approximately 15 leading
Chinese solar PV manufacturers to finance their current and future expansion needs,
though firms had drawn on approximately US$866 million in 2011 (Bakewell,
2011). The rapid scaling of solar PV manufacturing firms made possible by public
finance has quickly established Chinese solar technology manufacturers as major
international players. As such, they are able to slash the cost of solar PV panels so
quickly that much of the financial media argues that this access to credit is the
reason behind bankruptcies of solar companies based in the United States and Europe
(e.g. Forbes, 2011). The Brazilian Development Bank (BNDES) approved over
US$4.23 billion in clean technology financing in 2011 (Fried et al., 2012, p5). Today,
state investment banks are spending over US$100 billion annually on energy
efficiency and renewable projects (Louw, 2013), while clean energy project bond
issuance reached just US$3.2 billion in 2013 (FS-UNEP/BNEF, 2014, p44).
While precise figures comparing all public and private sources of finance for
renewable energy projects are not available, the picture is likely to be similar to
the ‘Global Landscape of Climate Finance’ (Climate Policy Initiative, 2013), which
includes all types of climate change mitigation and adaptation projects (Figure 9.3).
The green entrepreneurial state 141
FIGURE 9.3 Sources of finance for climate change adaptation or mitigation projects in
2012 (US$, billions)
Source: Based on data from Climate Policy Initiative (2013).
B illio n s
$123.0 bn
$102.0 bn
$66.0 bn
$33.0 bn
$21.0 bn
$12.0 bn
$1.0 bn
Development
Project
Finance
developers
Institutions
(including
public
utilities)
Corporate Households Commercial Government
Private
actors
Financial
(budgets)
Equity,
Institutions
Venture
Capital and
Infrastructure
funds
$0.4 bn
Institutional
Investors
$140
$120
$100
$80
$60
$40
$20
$0