

140 Mariana Mazzucato
Yet, failure of some governments to provide the vision and to ‘push’ clean
technology is having an impact on the amount of investment occurring. Countries
that pursue a patchy policy towards clean technology will not stimulate enough
investment to alter their ‘carbon footprints’, nor should they expect to host the
clean technology leaders of the future. An example of a country going for a ‘big
push’ is China; Germany is also a first mover among European countries. The US
has shown contradictory trends, with the State making early and substantive invest -
ments in green technologies. By proceeding without a clear vision and goal in
mind, however, and without a long-term commitment to several key technologies,
the US has failed to alter significantly its energy mix, despite the bigger push at
the state level (notably in California, North Carolina and, surprisingly, Texas)
(Carley, 2011; Prasad and Munch, 2012). The UK is also lagging behind.
In the US, the 2009 American Recovery and Reinvestment Act stimulus
packages devoted 11.5 per cent of their budget to clean technology investments,
lower than China (34.3 per cent), France (21 per cent) or South Korea (80.5 per
cent), but higher than the UK (6.9 per cent). In July 2010, the South Korean
government announced that it would double its spending on green research to
the equivalent of US$2.9 billion by 2013 (almost 2 per cent of its annual GDP),
which means that between 2009 and 2013 it will have spent US$59 billion on this
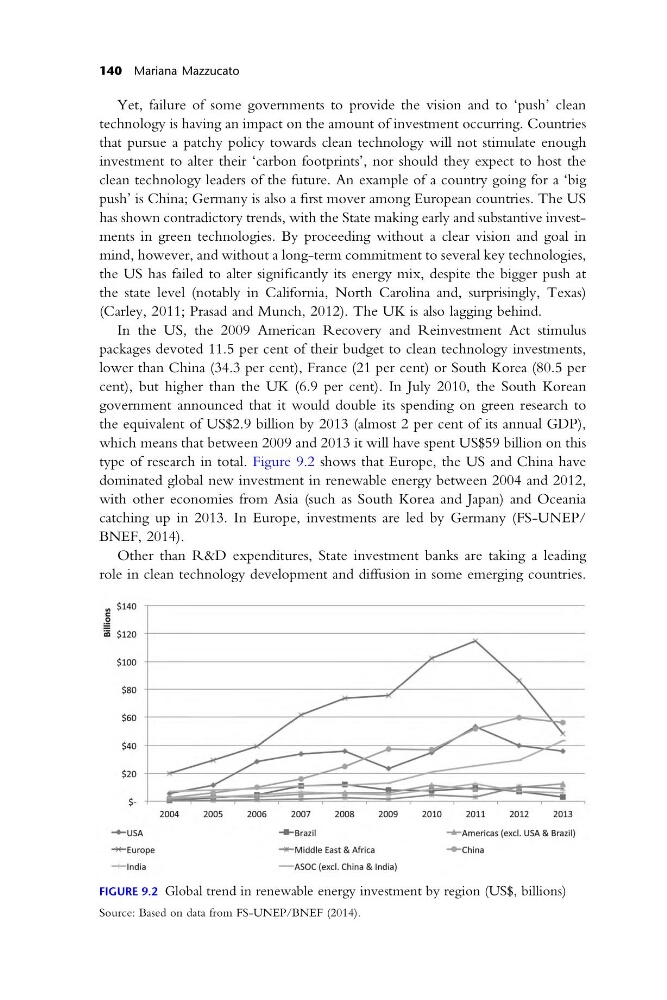
type of research in total. Figure 9.2 shows that Europe, the US and China have
dominated global new investment in renewable energy between 2004 and 2012,
with other economies from Asia (such as South Korea and Japan) and Oceania
catching up in 2013. In Europe, investments are led by Germany (FS-UNEP/
BNEF, 2014).
Other than R&D expenditures, State investment banks are taking a leading
role in clean technology development and diffusion in some emerging countries.
FIGURE 9.2 Global trend in renewable energy investment by region (US$, billions)
Source: Based on data from FS-UNEP/BNEF (2014).
Billions
-♦-USA
-■-Brazil
-^-Americas (excl. USA & Brazil)
-*~Europe
-^-M iddle East & Africa
-•-China
-I—India
ASOC (excl. China & India)
$ 1 4 0
$ 1 2 0
$ 1 0 0
$ 8 0
$ 6 0
$ 4 0
$ 2 0
$ -
2 0 0 4
2 0 0 5
2 0 0 6
2 0 0 7
2 0 0 8
2 0 0 9
2 0 1 0
2 0 1 1
2 0 1 2
2 0 1 3
Yet, failure of some governments to provide the vision and to ‘push’ clean
technology is having an impact on the amount of investment occurring. Countries
that pursue a patchy policy towards clean technology will not stimulate enough
investment to alter their ‘carbon footprints’, nor should they expect to host the
clean technology leaders of the future. An example of a country going for a ‘big
push’ is China; Germany is also a first mover among European countries. The US
has shown contradictory trends, with the State making early and substantive invest -
ments in green technologies. By proceeding without a clear vision and goal in
mind, however, and without a long-term commitment to several key technologies,
the US has failed to alter significantly its energy mix, despite the bigger push at
the state level (notably in California, North Carolina and, surprisingly, Texas)
(Carley, 2011; Prasad and Munch, 2012). The UK is also lagging behind.
In the US, the 2009 American Recovery and Reinvestment Act stimulus
packages devoted 11.5 per cent of their budget to clean technology investments,
lower than China (34.3 per cent), France (21 per cent) or South Korea (80.5 per
cent), but higher than the UK (6.9 per cent). In July 2010, the South Korean
government announced that it would double its spending on green research to
the equivalent of US$2.9 billion by 2013 (almost 2 per cent of its annual GDP),
which means that between 2009 and 2013 it will have spent US$59 billion on this
type of research in total. Figure 9.2 shows that Europe, the US and China have
dominated global new investment in renewable energy between 2004 and 2012,
with other economies from Asia (such as South Korea and Japan) and Oceania
catching up in 2013. In Europe, investments are led by Germany (FS-UNEP/
BNEF, 2014).
Other than R&D expenditures, State investment banks are taking a leading
role in clean technology development and diffusion in some emerging countries.
FIGURE 9.2 Global trend in renewable energy investment by region (US$, billions)
Source: Based on data from FS-UNEP/BNEF (2014).
Billions
-♦-USA
-■-Brazil
-^-Americas (excl. USA & Brazil)
-*~Europe
-^-M iddle East & Africa
-•-China
-I—India
ASOC (excl. China & India)
$ 1 4 0
$ 1 2 0
$ 1 0 0
$ 8 0
$ 6 0
$ 4 0
$ 2 0
$ -
2 0 0 4
2 0 0 5
2 0 0 6
2 0 0 7
2 0 0 8
2 0 0 9
2 0 1 0
2 0 1 1
2 0 1 2
2 0 1 3